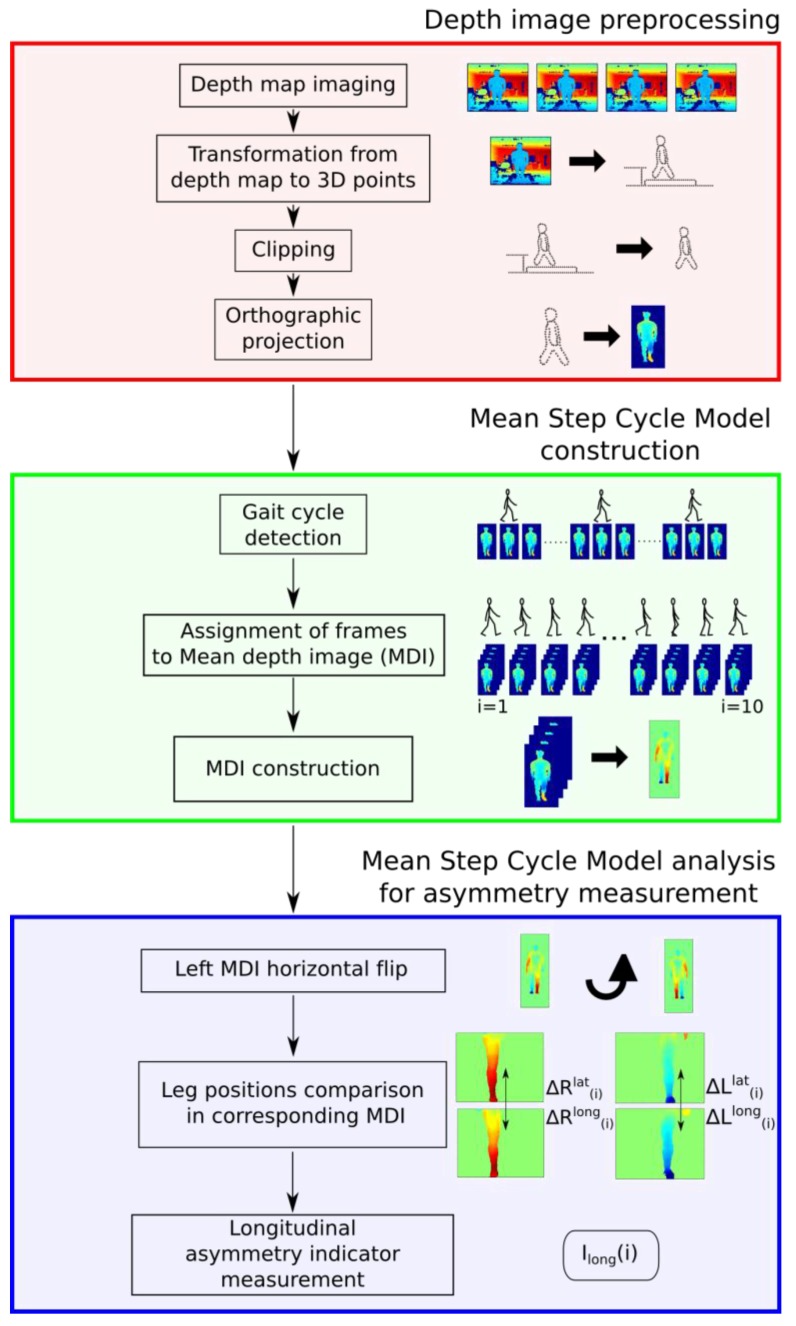
Figure 2.
Representation of the method for measuring asymmetry indices of lower limbs during the step cycle. In the red box are the depth image pretreatment operations. In the green box are the mean step cycle model construction steps. Finally, in the blue box are the different operations to construct the asymmetry indices.

