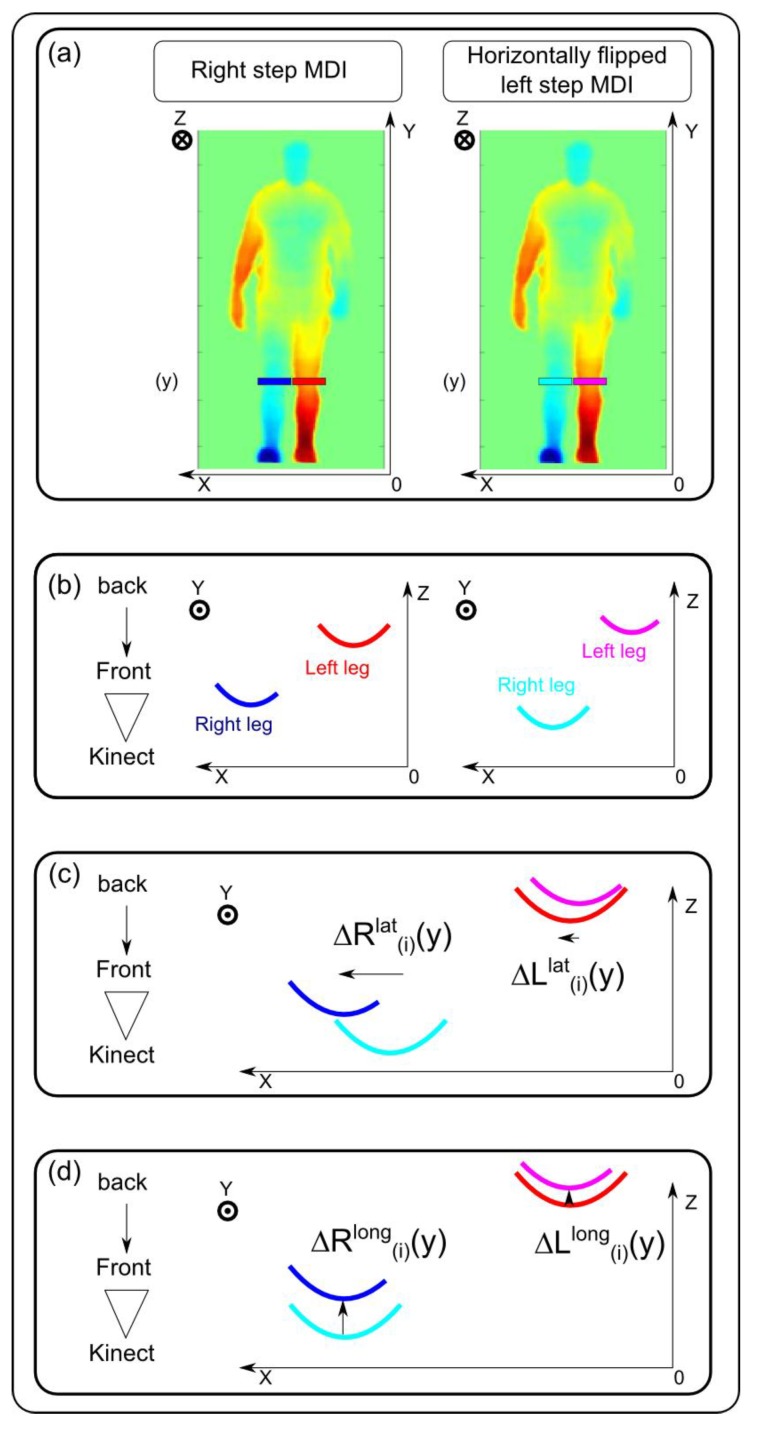
Figure 3.
(a) Position of the horizontal lines (y) selected in the legs from right step MDI(i) and corresponding left step fMDI(i), for lateral and longitudinal asymmetry evaluation; (b) representation of these horizontal lines in the transverse plane. Each leg depth curve is plotted in red and blue for, respectively, the right and left legs of the right step MDI(i) and cyan and magenta for, respectively, the right and left legs of the left step fMDI(i). (c) Lateral differences and are calculated with a lateral inter-correlation of corresponding leg depth curves; (d) once the legs of the left step are laterally registered on the legs of the right step, the depth differences and are computed by averaging the depth difference between depth curves.

