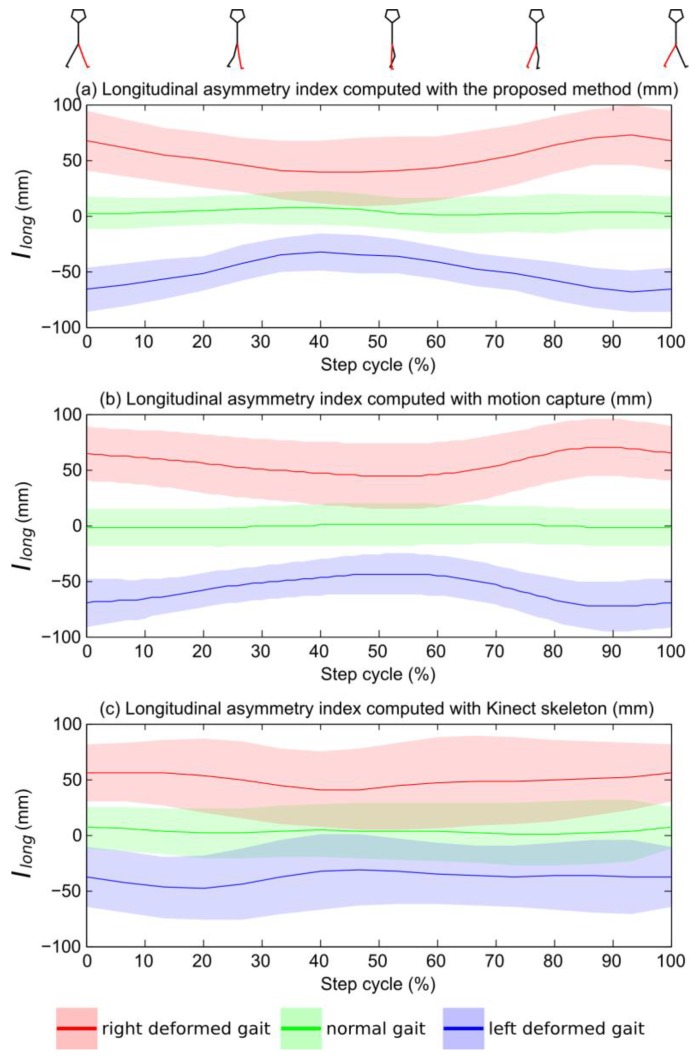
Figure 5.
Representation of mean Ilong(i) computed for each group (normal, left deformed, right deformed) from raw depth data with our method (a) from the skeleton computed with the motion capture data (b) and from the skeleton computed with the Kinect™ data. The colored zones define standard deviation intervals. An Ilong value close to zero indicates perfect symmetry of the gait.

