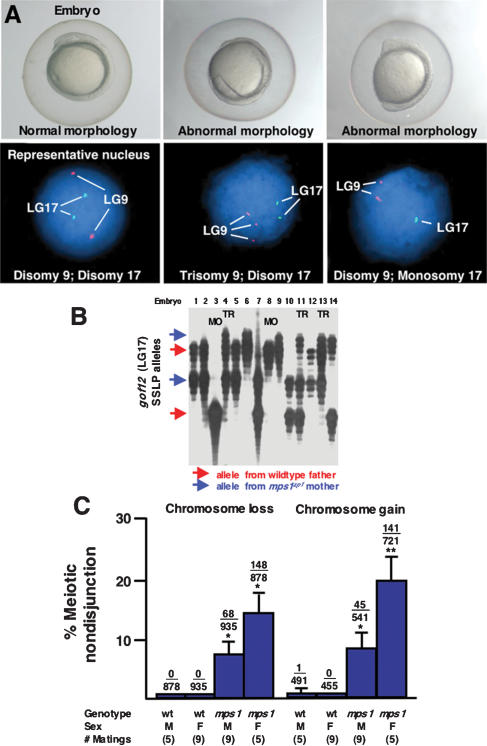
Figure 4.
A high frequency of aneuploidy in mps1zp1 germ lines. (A) Eight-somite stage embryos (top), and representative FISH analyses (bottom) indicating one DAPI-stained nucleus for linkage groups 9 (red probe) and 17 (green). (Left) Wild-type embryo with elongated body, tapered tail, and normal head structure, is disomic for both linkage groups. (Center) mps1zp1 embryo with degenerated head and malformed trunk and tail, is trisomic for LG9. (Right) mps1zp1 embryo with blunted head and tail is monosomic for LG17. (B) Auto-radiograph indicating genotypes for genetic marker gof12 on LG17, from dysmorphic progeny of a representative wild-type male × mps1zp1 female cross. Each lane represents one embryo. The two parents of this family displayed four differently sized gof12 PCR products; red arrows indicate two alleles from the wild-type father, whereas blue arrows indicate two alleles from the mps1zp1 mother. Note two embryos with maternal LG17 monosomy (MO) and three with maternal LG17 trisomy (TR). (C) Meiotic nondisjunction rates of wild-type and mps1zp1 fathers and mothers in wild-type × mps1zp1 crosses. Data were compiled from analysis of 273 dysmorphic embryos from mps1zp1 fathers, and 197 dysmorphic embryos from mps1zp1 mothers. The numbers above the error bars represent the total number of losses (monosomy) or gains (trisomy) among five chromosomes analyzed, divided by the total number of chromosomes with informative polymorphisms. Student's t-test, (*) p  0.001 versus wild-type male or female. (**) p
  0.001 versus wild-type male or female, p < 0.05 versus mps1zp1 father. All parents used for FISH and genotyping analyses were maintained at 25°C.

