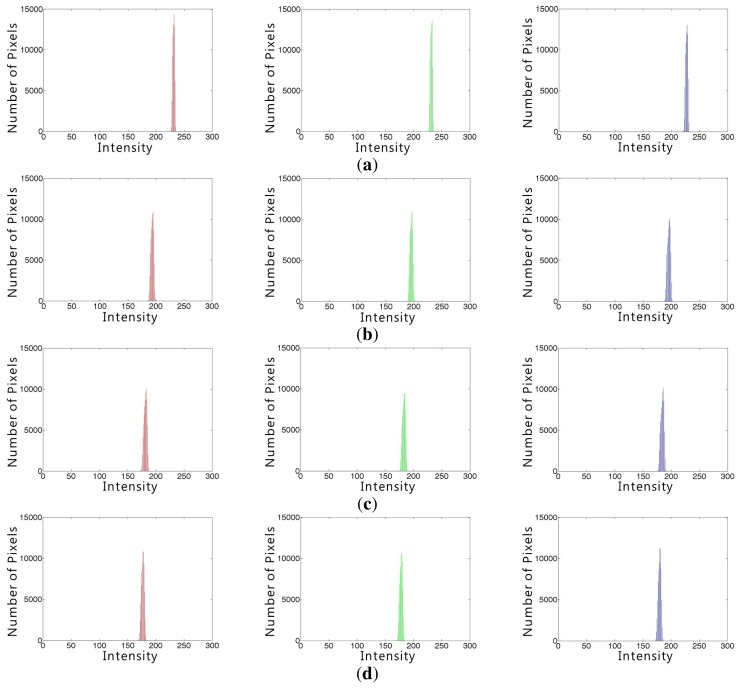
Figure 3.
The RGB color histograms of the white regions in Figure 1: (a) red, green and blue (from left to right) color histograms of the white regions of the haze-free image shown in Figure 1a; and (b–d) red, green and blue color histograms of the hazy images shown in Figure 1b–d.

