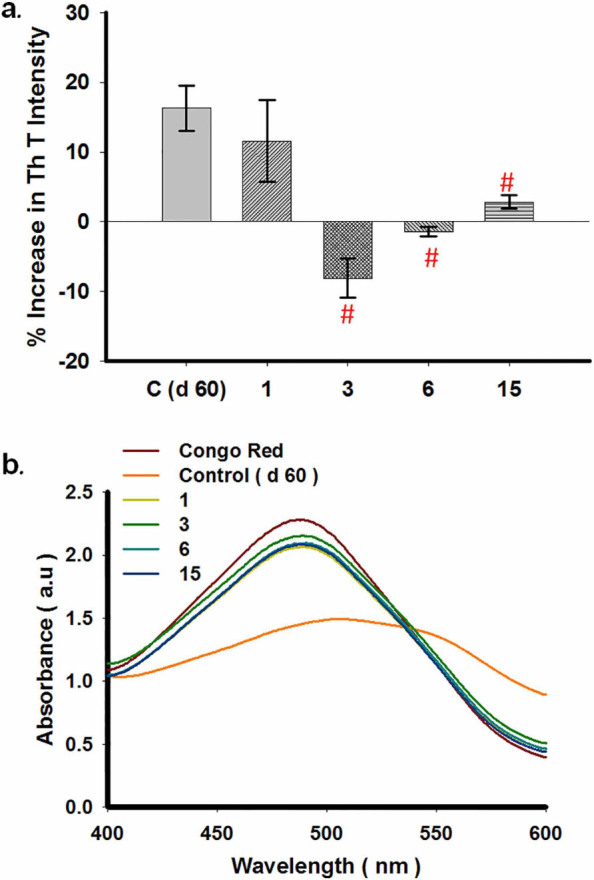
Figure 10. (a) Comparative bar diagram showing the effect of compounds 1, 3, 6 and 15 on 30 days aggregated WtAS by ThT assay. WtAS (210 µM) samples were aggregated alone for 60 days or equimolar concentrations of compounds 1, 3, 6 and 15 were added at day 30 and further co-incubated for 30 days. The ability of these compounds to prevent further aggregation was monitored by ThT assay. Aggregated samples were incubated with 50 µM of ThT for 30 min at 25°C. The samples were excited at 440 nm and emissions recorded at 480 nm. Percentage increase in aggregation was calculated by measuring corrected ThT fluorescence intensity. Results are the mean of three different experiments (n = 3) done in duplicate and the error bars show the standard deviations. # p < .005 control vs compounds 3, 6 & 15. (b) Absorbance spectra of Congo Red of aggregated WtAS samples in the presence or absence of compounds 1, 3, 6 and 15 on 30 days aggregated WtAS. WtAS (210 µM) samples were aggregated alone for 60 days or equimolar concentrations of compounds 1, 3, 6 and 15 were added at day 30 and were further co-incubated for 30 days. The ability of these compounds to prevent further aggregation was monitored by Congo red binding assay. Samples were incubated with 50 µM Congo Red for 1 h at 37°C and Absorbance was scanned from 400 nm–600 nm using UV-Vis spectrophotometer. Results are mean of three independent experiments done in duplicate.