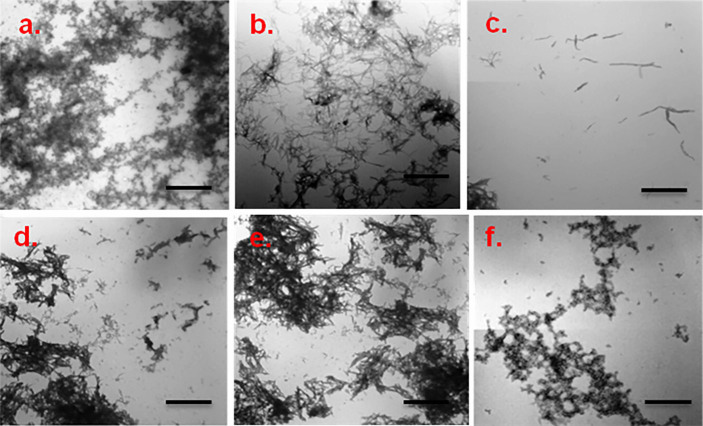
Figure 5. Representative TEM images showing aggregate morphology of WtAS in the presence and absence of compounds 1, 3, 6 and 15.
WtAS (210 µM) was co-incubated with equimolar concentration of compound 1, 3, 6 and 15 for 30 days. The ability of these compounds to prevent aggregation was visualised by TEM. 3 µl aggregated samples were adsorbed on carbon coated formavar grids and negatively stained with 2% uranyl acetate for TEM imaging. Representative TEM images of WtAS (210 µM) (a) alone at day 0 (b) alone at day 30 (c) compound 1 (d) compound 3 (e) compound 6 (f) compound 15. Scale bar is 200 nm.

