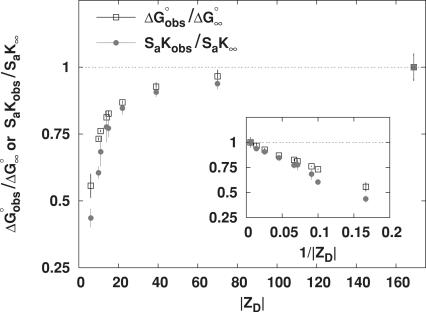
Figure 3.
Dependence of  (0.1 M Na+) and SaKobs on number of DNA charges |ZD|. Values of
  at 0.1 M Na+ (open squares) and SaKobs (circles), normalized by the corresponding quantities for binding of KWK6 to poly(dT), are plotted against the number of DNA charges |ZD|. Reanalysis of data published previously (22,23) and current work are detailed in Table 1. SaKobs was determined as the slope of Equation 6 fit in the loga± range of −1.1 to −0.72 (∼0.1–0.25 M [Na+]; cf. Figure 2B). All
  values were determined from reverse titrations with the exception of dT(pdT)6, for which
  was obtained by linear extrapolation of the logKobs vesus loga± to 0.105 M Na+ (Equation 6). The inset plots the same data versus 1/|ZD|.

