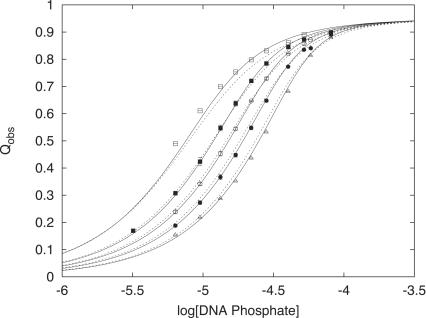
Figure 4.
Comparison of fitting models for KWK6 binding to dT(pdT) 22 at 0.105 M Na+ with ZL = 8, |ZD| = 22, and Qmax = 0.95. Symbols are as defined in Figure 1. The dashed line represents the global fit to the Epstein model (Equation 2) with logKobs = 5.605 ± 0.01. The solid line is the improved global fit to an Epstein model where two ligands can bind (Equation 12) with different affinities Kobs,1 and Kobs,2: logKobs,1 = 5.734 ± 0.01 and logKobs,2 = 5.434 ± 0.02. The Fχ-value (38), which tests the statistical significance of an increase in the number of fitting parameters, confirms that the use of two different binding constants describes KWK6-dT(dT)22 binding better (at a 95% confidence level) than the Epstein model with only one binding constant.

