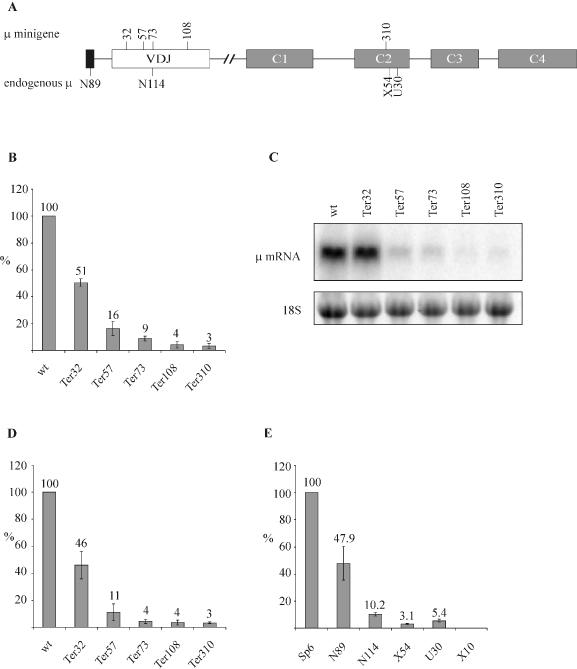
Figure 1.

Efficiency of NMD increases with 5′ to 3′ polarity. (A) Schematic representation of the Ig-μ gene, with numbers above depicting the amino acid positions where PTCs were inserted in the μ-minigene. The position of the PTC in the endogenous Ig-μ gene in the different hybridoma cell lines is shown below the diagram. The original clone names of the hybridoma cell lines are used throughout this paper (22). The PTC in cell line N89, N114, X54 and U30 is located at amino acid positions 3, 73, 325 and 335, respectively. (B) Relative Ig-μ mRNA levels of HeLa cells transiently transfected with the indicated Ig-μ minigenes under control of the human β-actin promotor were analyzed 48 h post transfection by real-time RT–PCR. The indicated relative Ig-μ mRNA levels were normalized to neomycin mRNA encoded on the transfected plasmid. ‘wt’ denotes the PTC-free Ig-μ minigene, the various PTC+ constructs are named ‘Ter’ (for termination) followed by a number indicating the amino acid position of the PTC. (C) Analysis of the same RNA used in (B) by northern blotting using a 32P-labeled probe for Ig-μ mRNA. As a loading control, the 18S rRNA band from the ethidium bromide-stained gel before blotting is shown in the lower panel. (D) HeLa cells were transfected with the same Ig-μ minigene constructs as in (B) and stably transfected polyclonal cell pools were generated by selection with Geneticin. Relative Ig-μ mRNA levels were determined by real-time RT–PCR as in (B) and normalized to relative endogenous GAPDH mRNA levels. (E) RNA of the parental hybridoma cell line Sp6, encoding a productively rearranged full-length Ig-μ mRNA, and of five Sp6-derived, mutated cell clones was analyzed. X10 has deleted the entire Ig-μ gene and serves as a negative control. Relative Ig-μ mRNA levels were determined by real-time RT–PCR as in (B) and normalized to relative 18S ribosomal RNA levels. In (B), (D) and (E), average values of three real-time PCR runs with cDNAs of one representative experiment are shown. Error bars indicate standard deviations.
