Figure 2.

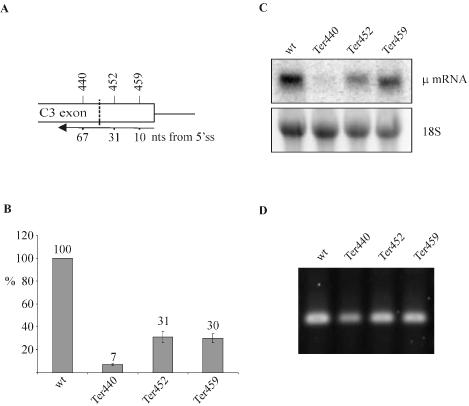
Testing the ‘50 nucleotides boundary rule’ for NMD of Ig-μ minigenes. (A) PTCs were introduced into exon C3 of the Ig-μ minigene at the amino acid positions indicated above the diagram. The numbers below depict the distance of these PTCs from the 3′-most 5′ splice site. The ‘50 nucleotides boundary’ is marked by the dashed line. (B) RNA of polyclonal HeLa cell pools stably transfected with the indicated Ig-μ minigenes under control of the human β-actin promotor were analyzed by real-time RT–PCR. The indicated relative Ig-μ mRNA levels were normalized to endogenous GAPDH mRNA. Average values of three real-time PCR runs of a typical experiment are shown. Error bars indicate standard deviations. (C) Northern blot analysis of RNA harvested 48 h post transfection with a 32P-labeled probe for Ig-μ mRNA. As a loading control, the 18S rRNA band from the ethidium bromide-stained gel before blotting is shown in the lower panel. (D) RT–PCR analysis of the RNA used in (B) to check for potential cryptic splicing between exon C3 and exon C4. Correct joining of exon C3 to exon C4 is predicted to give a PCR product of 163 bp.
