
Figure 6.
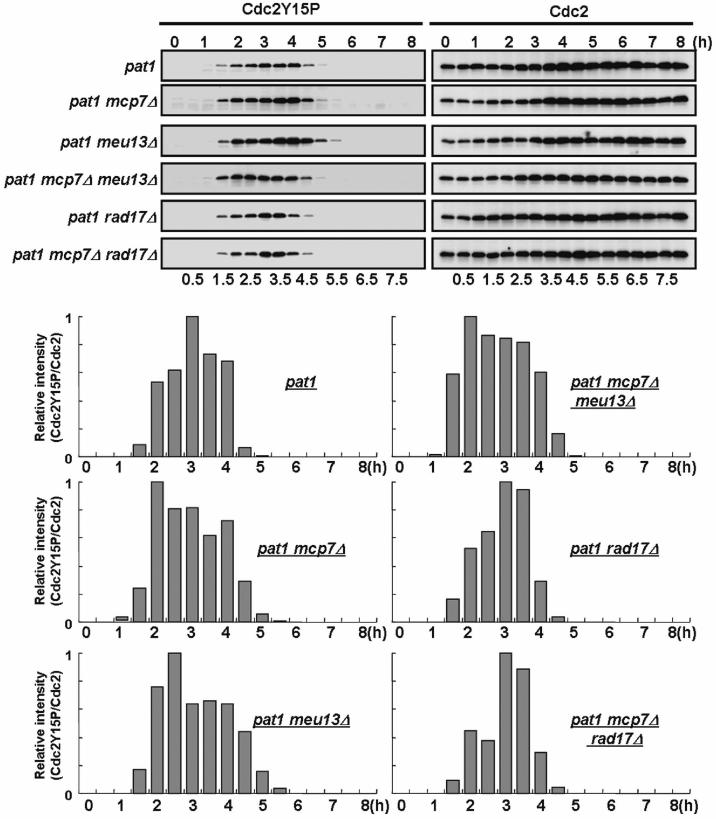
The dephosphorylation of the Tyr15 residue of Cdc2 is slightly prolonged in pat1mcp7Δ cells compared to pat1 cells. pat1 (JZ670), pat1mcp7Δ (ST31), pat1meu13Δ (KN8), pat1mcp7Δmeu13Δ (TK17), pat1rad17Δ (MS101-4) and pat1mcp7Δrad17Δ (ST87) cells were induced to enter meiosis as described in the legend to Figure 5. Samples were taken after the temperature shift at the indicated time points and western blot analysis was performed to detect the Cdc2 and phosphorylated Cdc2 levels. To quantify the result, the intensities of the bands were measured by a densitometer and the relative values were presented as bar graphs.