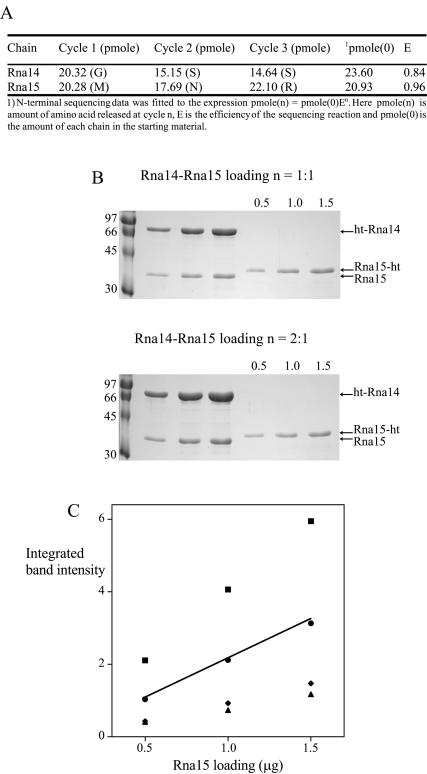
Figure 2.
The determination of the Rna14–Rna15 subunit stoichiometry. (A) N-terminal analysis of recombinant Rna14–Rna15 complex. Three cycles of Edman degradation were carried out on a sample of purified Rna14–Rna15. The table shows the yield of each residue at each cycle and the pmol quantity of each chain. Accounting for the reaction efficiency (E) a value for the quantity of each chain in the starting material, pmol(0) was also determined. (B) SDS gels used in the densitometric analysis. Top, loadings of complex with an assumed stochiometry of 1:1. Bottom, loadings of complex with an assumed stoichiometry of 2:1. (C) Densitometric analysis of Rna14–Rna15 stoichiometry. Integrated band intensity is plotted against calculated Rna15 loading for complexes with assumed Rna14:Rna15 stoichiometries of 2:1, square; 1:1, circle; 1:3, diamond; and 1:4, triangle. The straight line is the best fit to actual RNA15-ht loadings of 0.5, 1.0 and 1.5 μg. Rna15-ht and ht-Rna14 indicate C- and N-terminally His-tagged Rna15 and Rna14, respectively.

