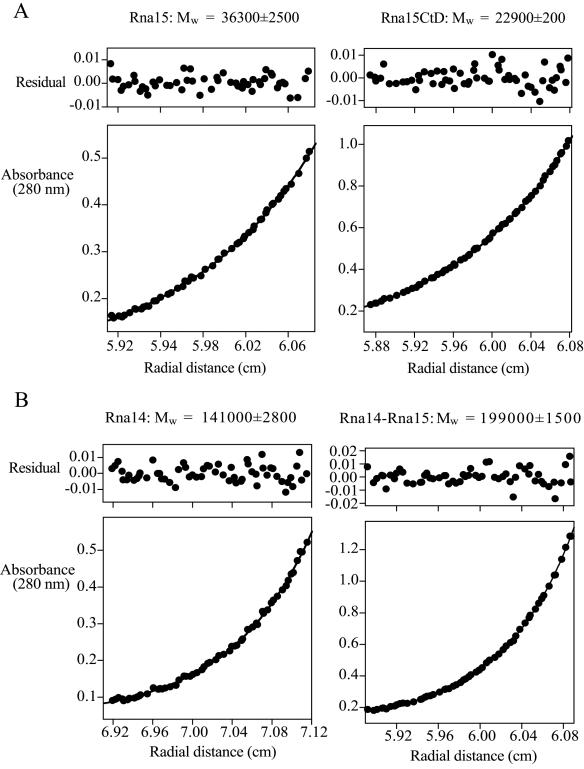
Figure 3.
Analysis of Rna14 and Rna15 by sedimentation equilibrium. (A) Bottom panels are typical concentration distributions at sedimentation equilibrium for 17 μM Rna15 at 17 000 r.p.m. and 44 μM Rna15CtD at 22 000 r.p.m. (B) Bottom panels are the concentration distribution at sedimentation equilibrium for 2.1 μM Rna14 and 5.7 μM Rna14–Rna15 at 10 000 r.p.m. The curves are the best fit to these data and the top panels are the residuals to this fit. The weight-averaged molecular weight, Mw, derived from global fitting, is shown above each.

