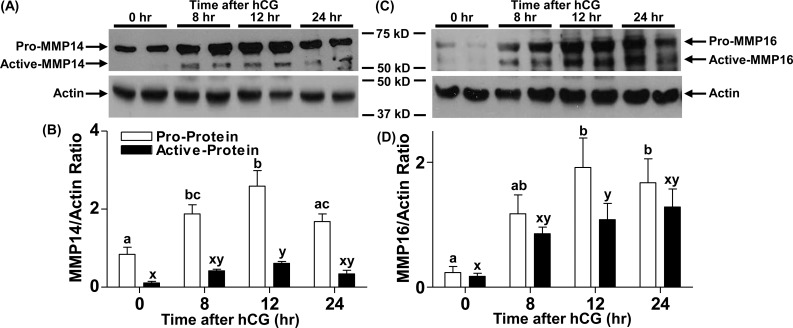
FIG. 3.
Changes in MMP14 and MMP16 protein levels in rat ovaries during the periovulatory period. Rat ovaries were obtained 0, 8, 12, and 24 h after hCG administration from eCG-primed rats and processed for protein analysis. Representative immunoblots of MMP14 and MMP16 in the rat ovarian lysates at different times after hCG administration (top blots in A and C, respectively) are shown. The beta-actin immunoblots are from the respective blots obtained after stripping of the primary MMP antibodies (bottom blots in A and C) are also shown. Densitometric analysis was used to semiquantitate the changes in pro-MMP14 and active MMP14 (B) and in pro-MMP16 and active MMP16 (D). Arbitrary optical density units measured for proform and active form using ImageJ software were normalized to those measured for the internal control beta-actin. The graph depicts the mean ± SEM (n = 4 animals/group). Groups with no common letters are significantly different (P < 0.05).

