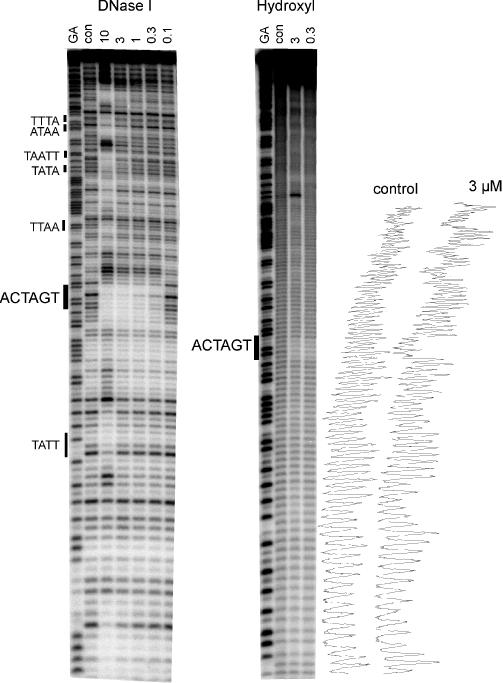
Figure 2.

DNase I and hydroxyl radical footprinting of thizaotropsin A on the MS2 DNA fragment. The ligand concentration (μM) is shown at the top of each lane. Digestion of the DNA in the absence of added ligand is indicated by ‘con’. Tracks labelled ‘GA’ are Maxam–Gilbert sequence markers specific for purines. Densitometer traces of the control and 3 μM lanes of the hydroxyl radical cleavage are shown on the right.
