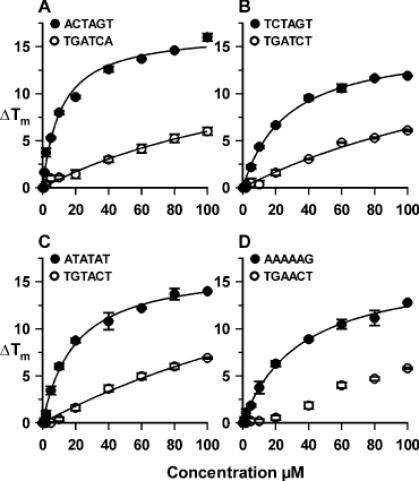
Figure 5.

Plots showing the variation of ΔTm with ligand concentration for the eight fluorescently labelled duplexes. The curves were fitted to the data using the equation ΔTm = ΔTm,max × L/(L+C50) and are described by the parameters shown in Table 2. The C50 values have no direct physical meaning, but provide a convenient means for comparing the relative effects of the ligand on the different sequences.
