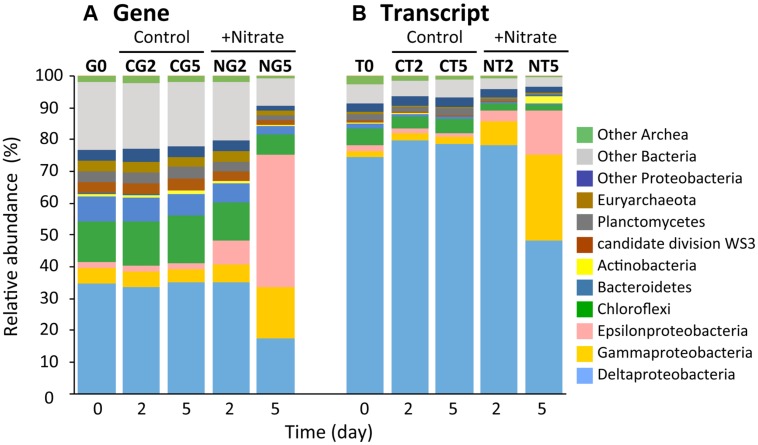
FIGURE 3.
Dynamic transition of microbial communities during anoxic incubation of marine sediments as determined by Illumina sequencing of 16S rRNA genes (A) and transcripts (B). Relative abundances of 16S rRNA genes (‘G’) and transcripts (‘T’) defined phylogenetically are represented by the colors shown at the right side of the graph. The sequence libraries were obtained from the incubation at day 0 (designated the G0 and T0 libraries) and at days 2 and 5 in the nitrate-amended sediment (‘N’; designated the NG2, NG5, NT2, and NT5 libraries) and in the control (‘C’; designated the CG2, CG5, CT2, and CT5 libraries). The sequence library is indicated at the top of each bar.

