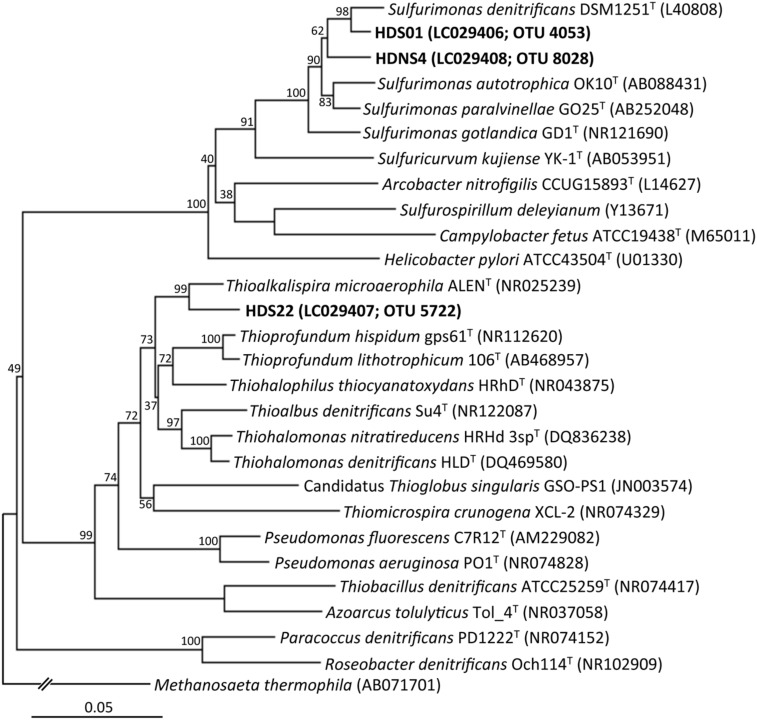
FIGURE 5.
Phylogenetic tree showing the taxonomic distribution of 16S rRNA genes from isolates (the strains HDS01, HDNS4, and HDS22), and their known cultivated relatives. The tree was constructed by the neighbor-joining method using the nearly full-length 16S rRNA gene sequences. Bootstrap values were obtained from 1,000 replications. The scale bar represents 5% sequence divergence.

