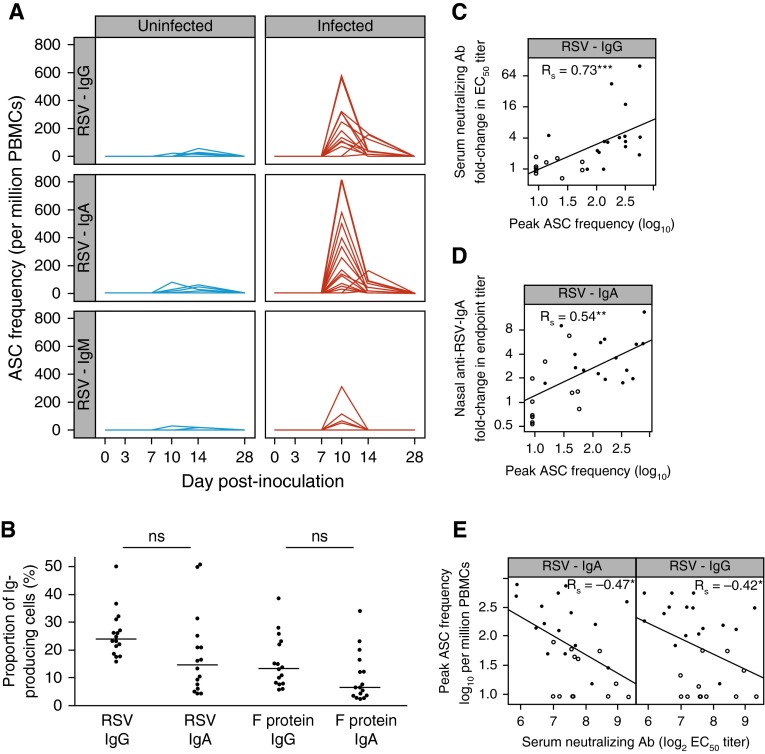
Figure 3.
Respiratory syncytial virus (RSV)–induced plasmablast expansion correlates with IgG and IgA increment. (A) Antigen-specific antibody (Ab)-secreting cells (ASCs) were enumerated using B-cell enzyme-linked immunospot with whole RSV lysate where sufficient peripheral blood mononuclear cells (PBMCs) were available. Uninfected (polymerase chain reaction–negative) subjects (n = 12) are shown in blue, infected (polymerase chain reaction–positive) subjects (n = 16) in red. (B) Peak antigen-specific ASC frequencies as percentage of total immunoglobulin-positive cells for infected subjects. Horizontal bars indicate the median. (C) Correlation of fold change in serum neutralizing Ab with peak IgG+ ASC frequency. (D) Correlation of fold change in nasal IgA against RSV with peak IgA+ ASC frequency (data from 27 subjects; nasal IgA in one subject could not be measured). (E) Correlation of peak ASC frequency with preinfection baseline serum neutralizing Ab titers. ASC frequencies are expressed as log10 per million PBMC. P values for unpaired Mann-Whitney Wilcoxon U tests and/or Spearman rank correlation coefficient (Rs) are shown as appropriate. Open circles = uninfected subjects; solid circles = infected subjects. Ab = antibody; EC50 = half-maximal effective concentration. ns = P > 0.05; *P < 0.05; **P < 0.01; ***P < 0.001.

