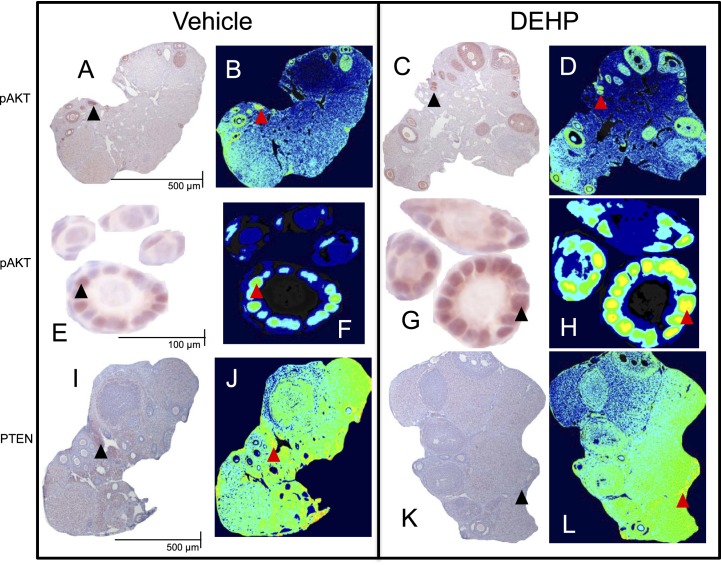
FIG. 5.
Representative images of immunohistochemistry and pseudocolored protein quantification. Panels A–H exhibit pAKT staining in the whole ovary (A–D) and in selected primordial and primary follicles (E–H). Panels I–L exhibit PTEN staining in the whole ovary. Panels A, B, E, F, I, and J were from vehicle control treated ovaries and follicles. Panels C, D, G, H, K, and L were from 20-μg/kg/day DEHP-treated ovaries and follicles. Black arrowheads represent positive staining in the immunohistochemistry images, which translate to the yellow/orange pseudocolored pixels represented by red arrowheads. Scale bars are set as 500 μm for whole ovary images (A–D and I–L) and 100 μm for follicle images (E–H) and the same scale bars should be used across each row.

