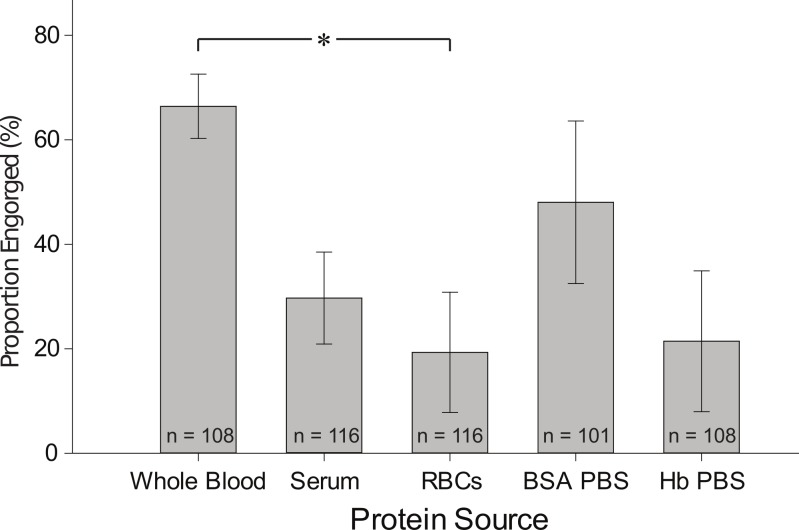
Figure 2. Proportion of fully engorged females fed on whole blood, serum, RBCs, BSA in PBS and Hb in PBS.
Data is representative of at least three independent trials. Graph represents mean ± SEM; n = number of females given the meal. The Mann-Whitney test was performed to determine statistical differences in comparison to whole blood: ∗ indicates significant difference at P < 0.05.

