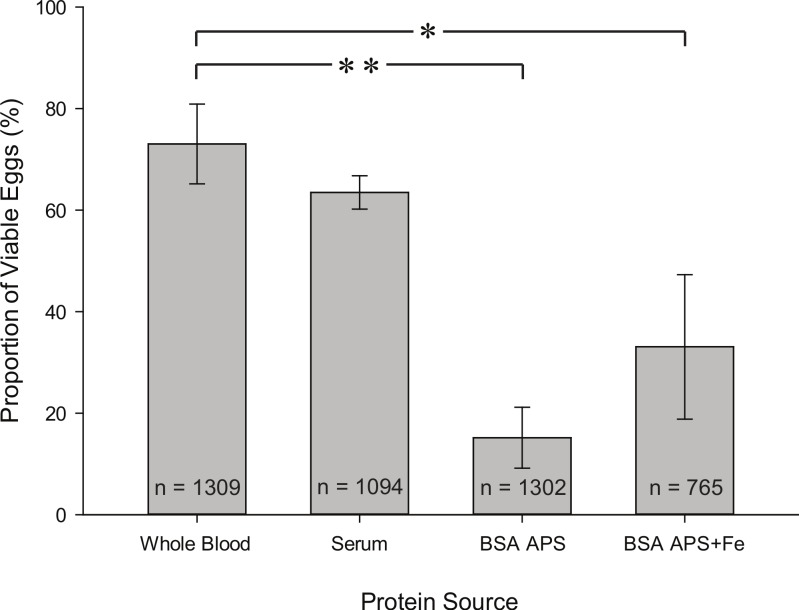
Figure 6. Proportion of viable eggs from females fed on whole blood, serum, BSA APS, and BSA APS + Fe.
Graph represents mean ± SEM of four trials. A One-way ANOVA test was performed to determine statistical differences between treatment meals versus the whole blood control (Holm–Sidak posttest): ∗ and ∗∗ denote statistical significance at P < 0.05 and P < 0.01, respectively. n = the number of eggs laid per treatment.

