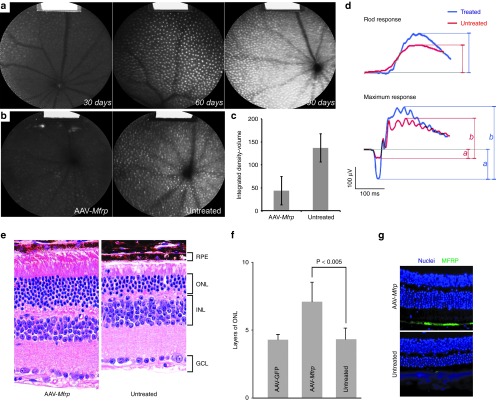
Figure 8.
AAV-Mfrp treatment on Mfrprd6/Mfrprd6 mice. (a) Quantitative AF images in Mfrprd6/Mfrprd6 mice at 30, 60, and 90 days of age. (b) Retinal fundus AF images of the untreated left eye (left) and the AAV-Mfrp-treated right eye (right) in Mfrprd6/Mfrprd6 mice. A fluorescence standard, shown as a bright strip at the top of each image, enabled intensity comparison. (c) Graphical quantification of AF level in treated and nontreated eyes (P = 0.02). (d) Rod-specific response and maximum response electroretinograms (ERGs) recordings from 11 Mfrprd6/Mfrprd6 mice that received AAV-Mfrp subretinal injection in right eye at 60 days after the transplantation surgery. Amplitudes of a-wave (**) indicated by letter “a” and b-wave (*) indicated by letter “b”. (e) Retinal histology (Hematoxylin and eosin staining) of a representative Mfrprd6/Mfrprd6 mutant retina (right panel) and AAV-MFRP transduced retina (left panel). GCL, ganglion cell layer; INL, inner nuclear layer; ONL, outer nuclear layer. (f) Quantification of ONL of AAV-GFP treated, AAV-Mfrp treated and nontreat eyes in Mfrprd6/Mfrprd6 mice. (g) Representative immunofluorescence pictures of retina histology sections stained by anti-mouse MFRP from AAV-Mfrp-treated eye (top) and non-treated eye (bottom) of Mfrprd6/Mfrprd6 mice.

