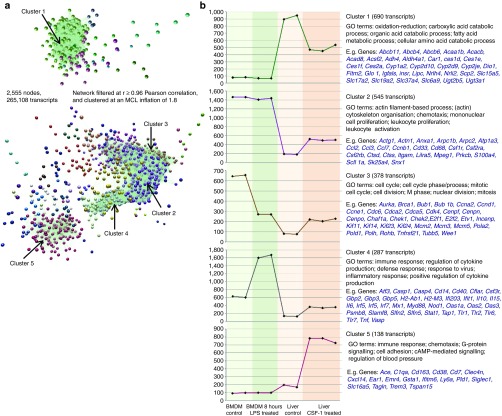
Figure 8.
Network analysis of liver transcripts post pig CSF1-Fc treatment. Expression data for mouse livers +/- CSF1-Fc (n = 3) was analyzed alongside that of BMDM expression data (+/- LPS). (a) A network graph of transcript-to-transcript Pearson correlation relationships was filtered to show relationships of r ≥ 0.96, resulting in a graph of 2,555 nodes (transcripts) connected by 265,108 edges (Pearson correlation relationships). The graph was then clustered using the MCL clustering algorithm into groups of co-expressed genes. Nodes with the same color belong to the same cluster of co-expressed genes and tend to be highly connected within the network. (b) Expression data for five clusters with each point on the graph representing an individual mouse.

