Figure 4.
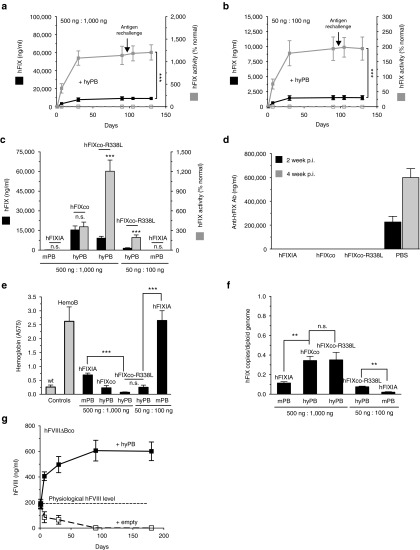
Enhancing PB performance for hemophilia A and B. Hemophilia B mice were hydrodynamically cotransfected with (a) 500 ng or (b) 50 ng of PB-hFIXco-R338L/IRmicro transposon with (a) 1,000 ng or (b) 100 ng of hyPB-expressing plasmid or an equimolar empty control plasmid (hatched lines). hFIX antigen levels (black) and FIX activity (gray) were measured on plasma samples collected at the indicated times by a specific enzyme-linked immunosorbent assay (ELISA) and a functional FIX assay, respectively (a–c). (c) Comparison of the original PB transposon system (PB-hFIXIA + mPB) versus the improved PB platform (PB-hFIXco + hyPB; PB-hFIXco-R338L/IRmicro + hyPB) in hemophilic mice using either 500 or 50 ng PB transposon (PB-hFIXIA, PB-hFIXco, or PB-hFIXco-R338L/IRmicro) and 1,000 ng or 500 ng PB transposase, respectively (mPB or hyPB, as indicated). A ratio of 1:2 transposon/transposase was maintained. (d) Three months after transfection with PB transposons mice were subjected to immunization with recombinant hFIX antigen and adjuvant as indicated (a,b). Anti-hFIX specific antibodies were measured by ELISA at week 2 (black) and week 4 (gray) postimmunization (p.i). PBS-injected hemophilia B mice that were immunized with recombinant hFIX and adjuvant were used as positive control. (e) Tail-clipping assay on hemophilia B mice treated with the indicated transposon constructs and doses (black bars). Blood loss was determined by measuring the absorbance at 575 nm of hemoglobin content in the saline solution in which the tail was placed. Wild-type and untreated hemophilia B (Hemo B) mice were used as controls. (f) Transposon copies per diploid genome were determined on liver biopsies 6 months posttransfection. (g) FVIII antigen level in CB17/IcrTac/Prkdcscid mice hydrodynamically transfected with 500 ng PB-hFVIIIΔBco/IRmicro transposon plasmids along with 1,000 ng hyPB-expressing plasmid or an equimolar empty control plasmid (hatched lines). Physiologic hFVIII concentration (100% = 200 ng/ml) is indicated. hFVIII antigen levels were detected by ELISA. Results were presented as mean ± SEM. n.s. indicates not significant, *P < 0.05; **P < 0.01; ***P < 0.001 (n = 3 mice/group).

