
Figure 2.
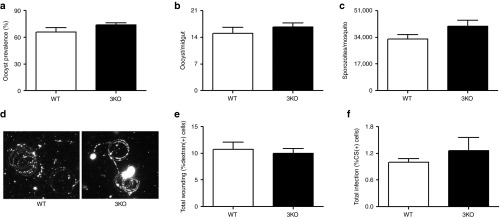
Mosquito stage development, and in vitro sporozoite host cell traversal and invasion assays. (a) Prevalence of oocysts in mosquito midguts infected with WT and 3KO parasites. Oocyst prevalence (plotted as mean ± SEM) was calculated by dividing the number of dissected midguts containing oocycts by the total number of midguts on day 7 postfeeding of mosquitoes with in vitro gametocyte cultures. Prevalence was determined in several mosquitoes four independent times in duplicate and quadruplicate for WT and 3KO, respectively. Mann–Whitney U-test was used for statistical analysis. (b) Comparison of average number of oocysts per mosquito midgut (plotted as mean ± SEM) between WT and 3KO on day 7 postfeeding of mosquitoes. Oocyts numbers were determined in several mosquitoes four independent times in duplicate and quadruplicate for WT and 3KO, respectively. Mann–Whitney U-test was used for statistical analysis. (c) Comparison of average number of sporozoites per mosquito (plotted as mean ± SEM) between WT and 3KO on 14–16 days postfeeding of mosquitoes. Sporozoite numbers were determined three independent times in at least duplicate for each line. Mann–Whitney U-test was used for statistical analysis. (d) Staining of CSP trails using Alexa 488-conjugated anti-PfCS 2A10 antibody in motility assays of salivary gland sporozoites from WT and 3KO. Sporozoites were collected 14–16 days postfeeding of mosquitoes. (e) Average total of HC-04 cells in traversal assays with WT and 3KO salivary gland sporozoites (plotted as mean ± SEM) as measured by the fraction of total HC-04 cells in the sample that had taken up FITC-dextran. Total dextran positive cells were determined four independent times in duplicate for each line. Mann–Whitney U-test was used for statistical analysis. (f) Average total infection of HC-04 cells by WT and 3KO salivary gland sporozoites (plotted as mean ± SEM) as measured by the fraction of total HC-04 cells in the sample that were positive for intracellular parasites as measured by CS staining. Total CS-positive cells were determined four independent times in duplicate for each line. Mann–Whitney U-test was used for statistical analysis CS, circumsporozoite; FITC, fluorescein isothiocyanate.