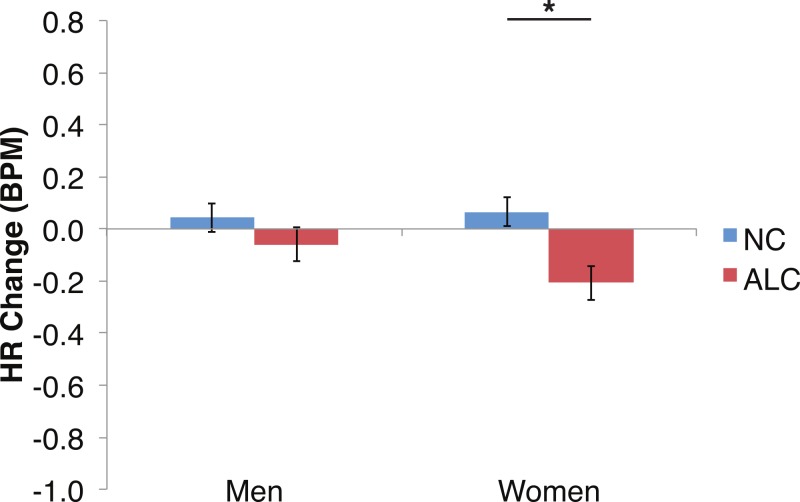
Figure 6. Heart rate (HR) tended to decline more in alcoholics in response to the encoded faces than in nonalcoholics.
Bar height indicates beats per minute (BPM). Data are presented for alcoholic participants (ALC, in red) and nonalcoholic participants (NC, in blue), split by gender. The asterisk indicates a significant difference, and error bars represent standard error. No significant interactions were identified.

