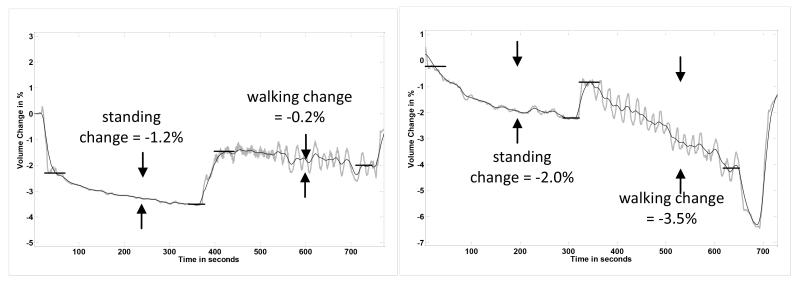
FIGURE 5a,b. Results from a congestive heart failure patient (Case 4).
Only one set of stand and walk segments is shown in each plot. The ranges on the vertical axes are the same for both panels. (a) On a healthy diet. (b) After 3 wk on a high salt diet. Conductive tissue volume reductions during the stand and walk segments were much greater after 3 wk on a high salt diet than on a healthy diet.

