
Figure 1.
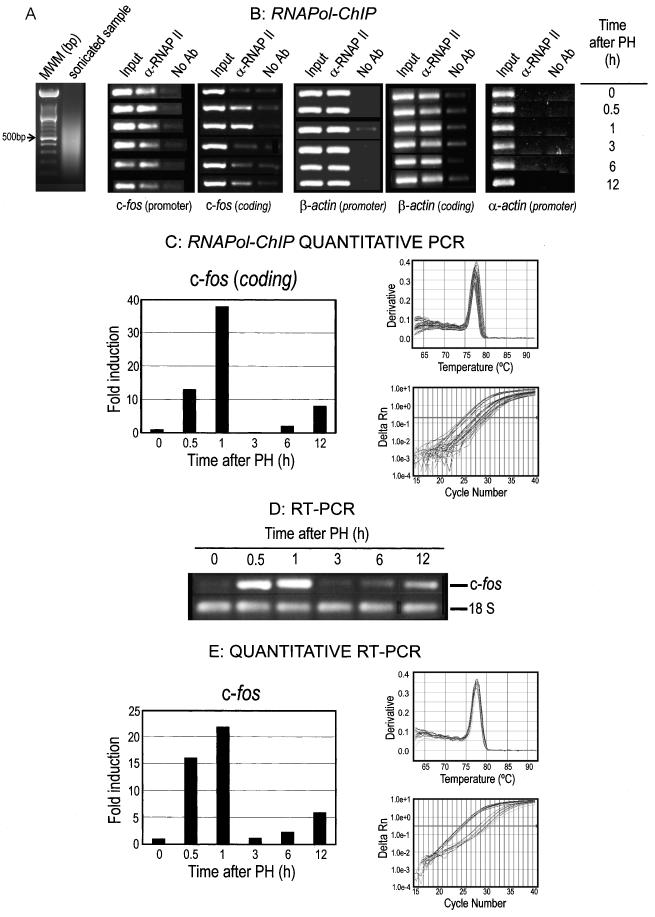
Time-course of c-fos transcription in rat liver after PH. (A) RNApol-ChIP analysis of c-fos transcription. The panels in the top row show the results of the PCR analysis of DNA extracted from input samples (I), the immunoprecipitates with anti-RNA polymerase II antibody (IP) and samples treated without antibody (NA) at several times after PH, using amplicons (see the text for details) from the promoter or coding regions of the indicated genes. The left panel shows an agarose gel electrophoresis of the sonicated samples to estimate the size of chromatin fragments. The lower panels show the results of a real-time quantitative PCR. To do this, DNA samples obtained in the assay (input, α-RNA pol II IP and No Ab) were used. The results of the No Ab samples at each time point were subtracted from those of the IP samples, the resulting figures divided by their corresponding input and finally plotted in a scale in which the final value of the control (0 h after PH) was arbitrarily set to 1. The melting curves of the amplicons and a plot of amplicon production versus number of cycles are given as PCR product verification. (B) RT–PCR analysis of c-fos transcription. The agarose gel electrophoresis of the RT–PCR products of c-fos and 18S rRNA, used as control, is shown for several times after PH. Quantitative RT–PCR analysis for c-fos is given below. The c-fos data were divided by those of the control 18S rRNA, and the histogram were constructed as above. The verification of PCR products was shown as in (A).