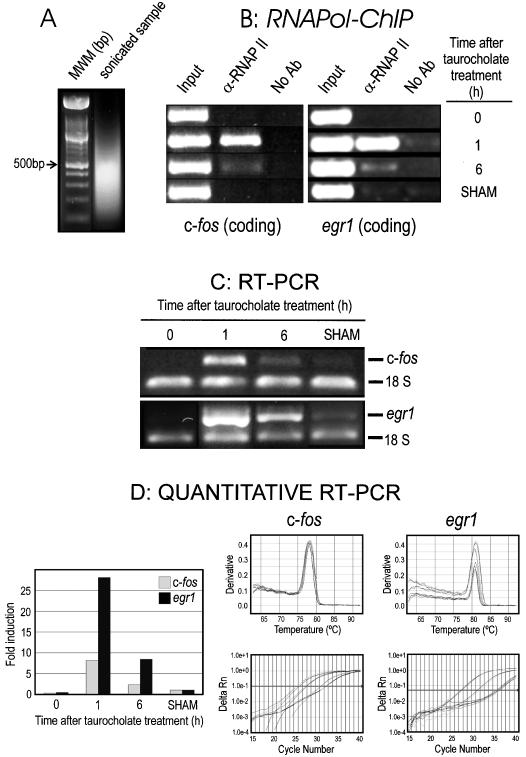
Figure 3.

Transcriptional analysis of c-fos and erg1 in rat acute pancreatitis induced in vivo by taurocholate. (A) RNApol-ChIP assay of c-fos and erg1 transcription. The results of semi-quantitative PCR analysis of DNA, using amplicons from the coding region of c-fos and erg1 genes (see the text for details), were shown for several times after the infusion of taurocholate into the biliopancreatic duct, and in a sham-operated rat (SHAM). The left panel shows an agarose gel electrophoresis of the sonicated samples to estimate the size of chromatin fragments. (B) RT–PCR analysis of c-fos and erg1 transcription. The data were obtained and plotted as in Figure 1B.
