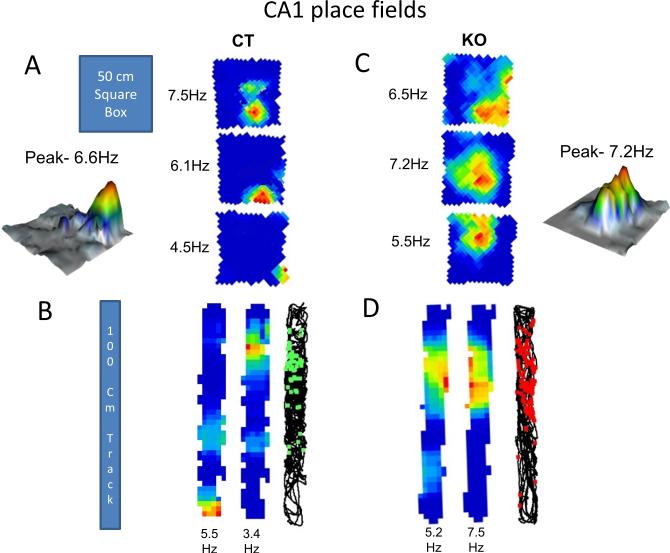
Figure 1. CA1 place fields in control and HCN1 KO mice.
(A and C) CA1 place cell firing rate maps for CT (A) and KO (C) mice recorded as they freely explored a 50 × 50 cm square box for 10-15 minutes. Numbers on the left are peak firing rates (Hz). Representative 3D plots from CT and KO group showing peak firing rates. (B and D) Firing rate maps for CT (B) and KO (D) mice respectively after they explored the 100 cm linear track for 10-15 minutes. See Supplementary Figure S4 for recording locations in CA1 region. Also see Supplementary Figure S5 for examples of place cell clusters, average waveforms and autocorrelations.

