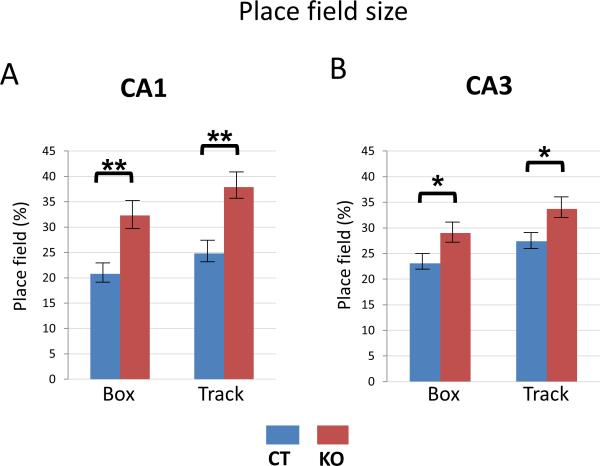
Figure 3. Place field size is increased in both CA1 and CA3 regions of HCN1 knockout mice.
(A) CA1 place fields of KO mice were larger than those of CT mice in both Box (p<0.01) and Track (p<0.01) enclosures. (B) CA3 place fields of KO mice were larger than those of CT mice in both Box (p<0.05) and Track (p<0.05) enclosures. Data show means ±SEM. See Supplementary Figure S3 for intrinsic frequencies of CA1 and CA3 place cells and interneurons.

