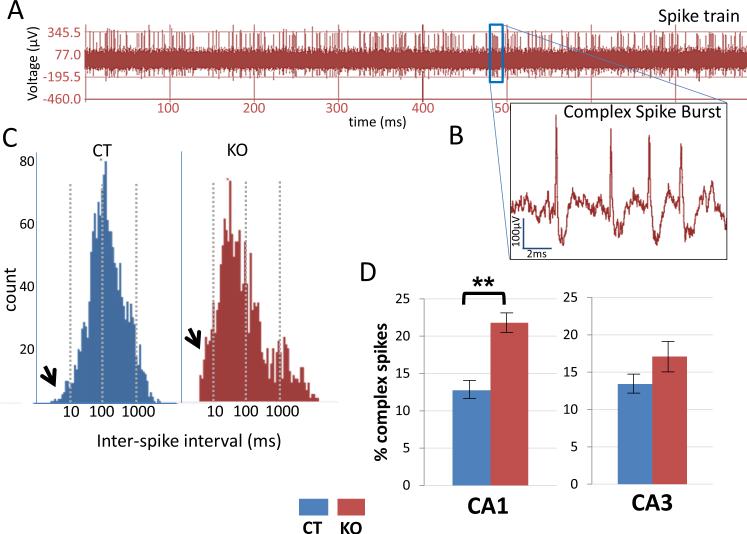
Figure 6. HCN1 KO mice show an increase in complex spike burst firing.
(A) Spike train recording of action potentials from a CA1 pyramidal neuron.
(B) Expanded trace from A showing a single complex spike burst.
(C) A histogram of Inter-spike intervals (ISI) of place cells from CA1 showing more spikes in 0-10 ms bin (arrows) in KO mice compared to CT mice. Notice how the histogram for KO mice is shifted towards shorter intervals. (D) Plots show increase in percent of complex spike bursts in CA1 place cells for KO versus CT mice (p<0.01). There is no significant difference in complex spike bursts in CA3. Data show means ± SEM. See Supplementary Figures S1 and S2 for intrinsic properties of CA3 and burst firing properties of CA3 respectively.

