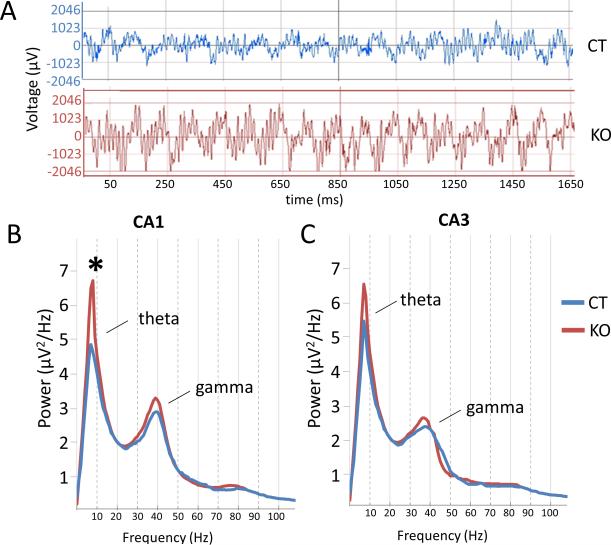
Figure 7. Theta and gamma power are enhanced in HCN1 KO mice.
(A) Examples of local CA1 field potentials in HCN1 KO and CT mice, showing theta and gamma oscillations.
(B) Power spectra for CA1 field potentials showing increased theta power in KO compared to CT mice (p<0.05). There was a small statistically insignificant increase in gamma power.
(C) Power spectra from CA3 region showing modest, statistically insignificant increases in theta and gamma frequencies in KO mice.

