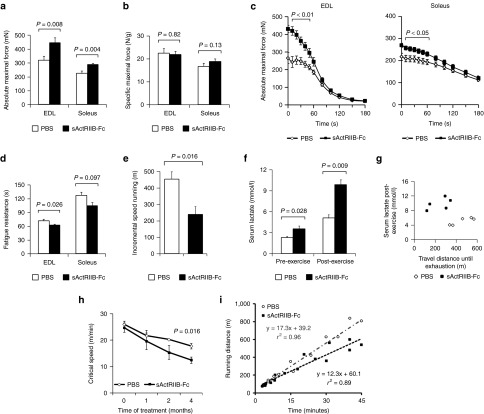
Figure 1.
Treatment of adult wild-type mice with soluble activin IIB receptor (sActRIIB-Fc). All tests were done after a 4-month treatment of the wild-type mice with either sActRIIB-Fc or PBS (controls). (a) Absolute maximal force (n = 10 for each condition), and (b) specific maximal force of EDL and soleus muscles (n = 10 for each condition). (c) Force recordings during the fatigue protocol over 180 seconds, and (d) fatigue resistance of EDL (n = 9 for PBS-treated mice and n = 8 for sActRIIB-Fc-treated mice) and soleus muscles (n = 10 for PBS-treated mice and n = 9 for sActRIIB-Fc-treated mice). (e) Running distances during incremental speed running until exhaustion (n = 5 for each condition). (f) Serum lactate levels at rest and 5 minutes after incremental speed running until exhaustion (n = 5 for each condition). (g) A plot depicting the relationship between travel distance until exhaustion during incremental speed running and serum lactate, which was measured 5 minutes after exhaustion, for individual mice (n = 5 for each condition). (h) Critical speed before and after 1, 2, and 4 months of treatment with sActRIIB-Fc in comparison to PBS-treated control mice (n = 5 for each condition). (i) A plot depicts the proportional relationship between distance run (y-axis) and time to exhaustion (x-axis) at different velocities. The slope of the regression line indicates the Critical Speed. Values are shown as means ± SEM. P values were calculated using the nonparametric U-test.

