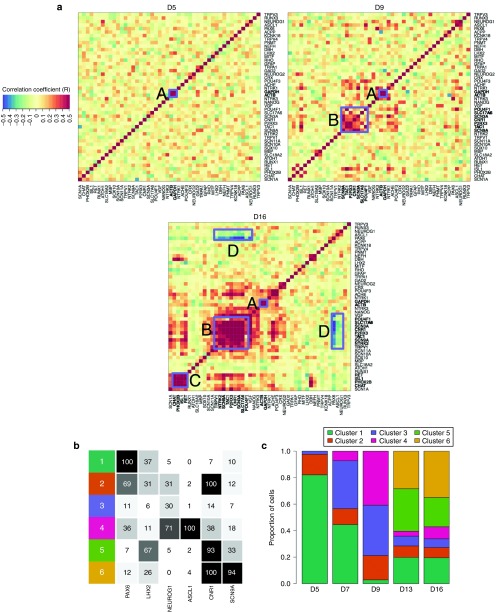
Figure 3.
Intergene expression correlations and single-cell clustering. (a) Genes are clustered by hierarchical single linkage clustering based on the Euclidean distance between rows of the day 16 matrix. Red squares indicate high intracellular correlation between expression levels of pairs of genes. Four groupings of genes mentioned in the text are highlighted: (A) housekeeping genes; (B) sensory neuron markers; (C) sympathetic markers; (D) neuroectodermal and neural crest markers. (b) The percentage of cells in each of the six clusters of cells (1–6) identified by PAM expressing the given marker gene. (c) The proportion of all cells at each timepoint included in each cluster of cells.

