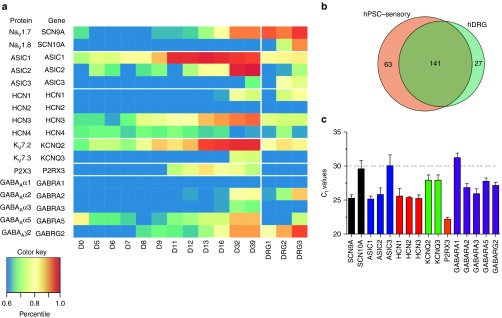
Figure 4.

Expression of sensory ion channel genes in human pluripotent stem cells (hPSC)-sensory during the directed differentiation time course and in hDRG samples. (a) The heatmap shows the expression values of selected ion channel genes given as percentiles of the genome wide expression levels. (b) The overlap between the total numbers of ion channel genes expressed in hPSC-sensory and hDRG is given in the Venn diagram. (c) qPCR analysis confirms the expression of sensory ion channels in hPSC-sensory.
