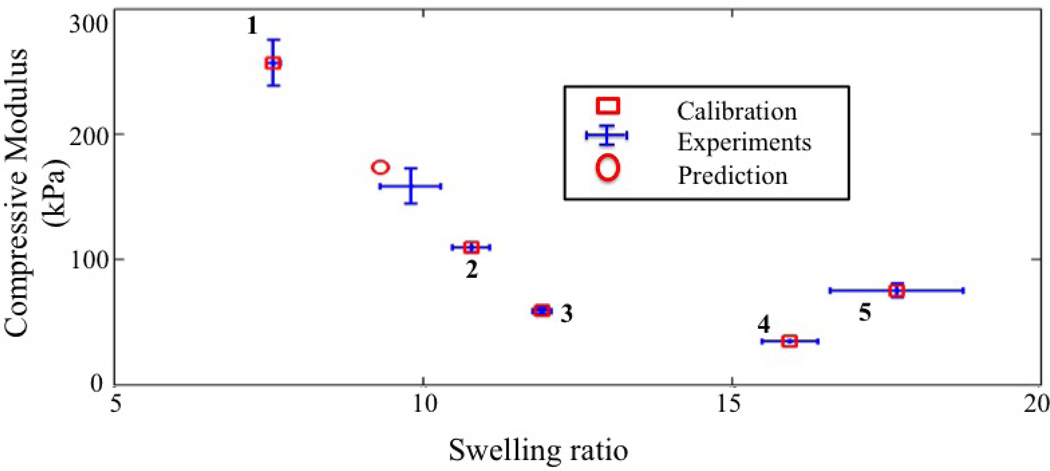
Figure 10.
Model validation. For a given hydrogel formulation (validation point in Fig.7), the map shown in Fig 9 was used to determine the cross-link density and polymer-solvent interaction parameters that lead to the compressive modulus and swelling ratio shown here for the validation point. Experiments for this gel formulation were also performed and compared with the prediction. We show here both calibration and validation points in the Ec-Q0 space.

