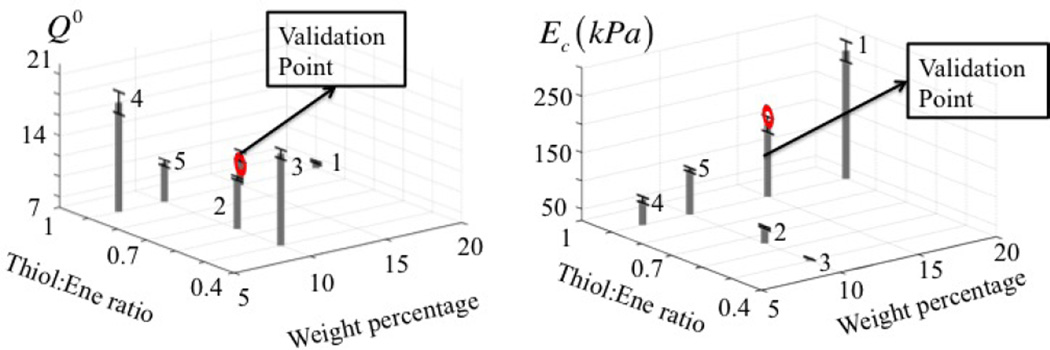
Figure 7.
Graphical representation of experimental results. A total of five PEG hydrogel designs was processed, for which both the equilibrium swelling ratio and Young’s modulus (compression) were determined. For each design, the tests were repeated three times in order to quantify uncertainties in measured quantities of interest (depicted by error bars). Apart from these another PEG hydrogel design is processed to validate the calibration.

