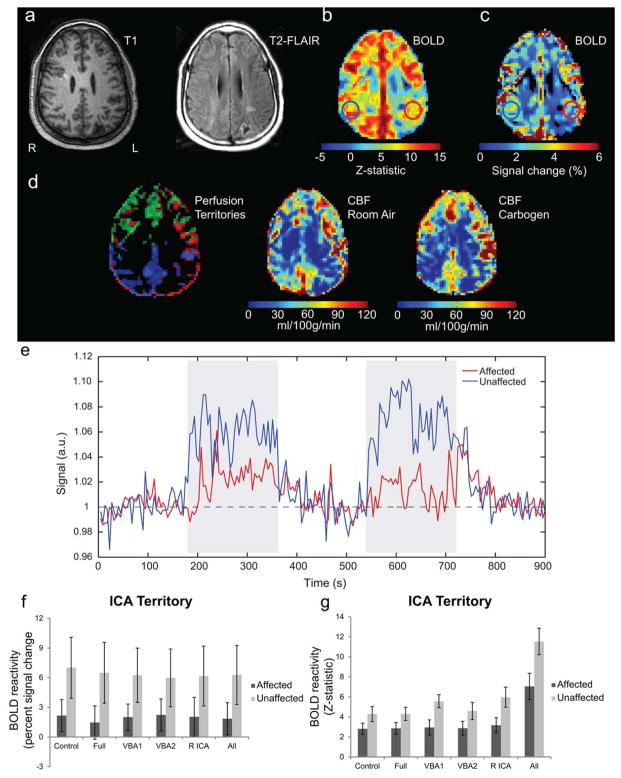
FIG. 2.
Single patient example demonstrating the information available from the dual echo VE-ASL sequence even in cases of excessive motion. A 46-year-old male (Patient 7, Table 1) with left petrous/cavernous ICA and left M1 stenoses. a: T1 and T2-FLAIR images depict a left posterior parietal region which suffered a previous ischemic event related to the L petrous/cavernous ICA/M1 stenoses. b: BOLD Z-statistic image which demonstrates the ability of the long-TE images to identify lateralizing contrast consistent with the stenosis. c: BOLD signal change map for the same slice; hemispheric asymmetry, however, is not as evident as in the Z-statistics. d: Perfusion territory along with baseline and carbogen CBF maps demonstrate the impact of ischemia on surrounding tissue. The perfusion territory map, however, indicates the R ICA is partly supplying the left hemisphere. e: Corresponding timecourse plots for the affected and unaffected regions. Notice a delay in the rise of the BOLD signal and overall lower CVR in the affected ICA territory. Together, these data demonstrate the additional information that can be provided by BOLD and ASL imaging in patients. f: Corresponding percent signal changes grouped by control and ASL labeling (Full, VBA1, VBA2, R ICA, and all labeling conditions combined) for the ICA territory regions identified in the signal change image. All signal changes were significantly greater (P ≤ 0.01, Bonferroni corrected) in the unaffected territory compared to the affected territory. g: Corresponding BOLD Z-statistics grouped by control and ASL labeling pulses (Full, VBA1, VBA2, R ICA, and all labeling conditions combined) for the ICA territory regions identified in the BOLD image. These images are also sensitive (P ≤ 0.01, Bonferroni corrected) to hemispheric asymmetry, but display a sensitivity (P ≤ .006, Bonferroni corrected) to the labeling pulses (VBA1 and R ICA) not seen in the signal change maps (see Discussion).

