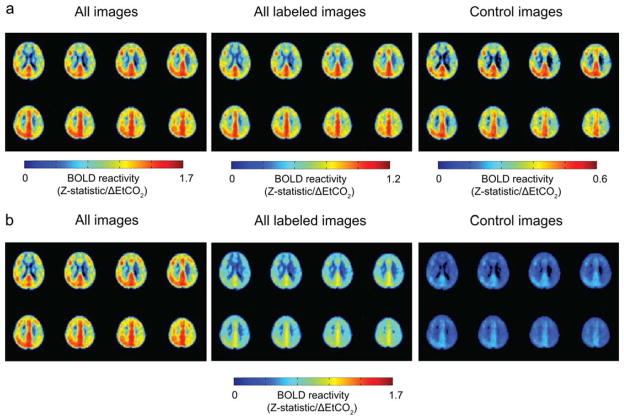
FIG. 3.
Group BOLD Z-statistics, normalized by the end-tidal CO2 change (ΔEtCO2), with affected hemisphere on radiological left. a: Normalized Z-statistic maps calculated from all labeling and control conditions, images acquired after only labeling conditions (Full, VBA1, VBA2, and R ICA), and images acquired after the control condition only. b: The same normalized Z-statistics as in (a), but scaled at the same intensity to demonstrate the difference in statistical power gained when calculating statistics using all BOLD images.

