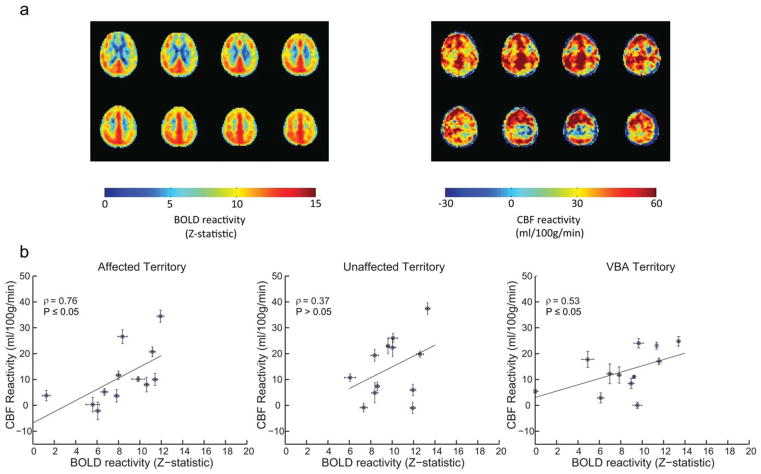
FIG. 5.
BOLD and CBF reactivity maps along with associated correlations within each territory. a: Group-wise BOLD and CBF reactivity, respectively. b: Scatter plot data, for all 12 subjects, between BOLD and CBF reactivity within each territory of interest, along with the associated Spearman’s rho. Correlations were strongest within the affected ICA territory (ρ = 0.76, P ≤ 0.05), followed by the VBA territory (ρ = 0.53, P ≤ 0.05). Correlations for the unaffected ICA territory (ρ = 0.37, P>0.05) were significant. Error bars represent the standard error. It should be noted that two patients presented with negative or nearly null CBF reactivity but positive BOLD reactivity in the affected hemisphere, which is addressed in the Discussion. Similarly two patients demonstrated similar patterns for the unaffected ICA territory, and one patient demonstrated this in VBA territory. When patients with such negative/null CBF reactivity were excluded from the analysis correlation values reduced slightly to ρ = 0.66 (P ≤ 0.05) for the affected territory, and increased to ρ = 0.65 (P ≤ 0.05) and ρ = 0.50 (P = 0.07) for the VBA and unaffected ICA territories, respectively.

