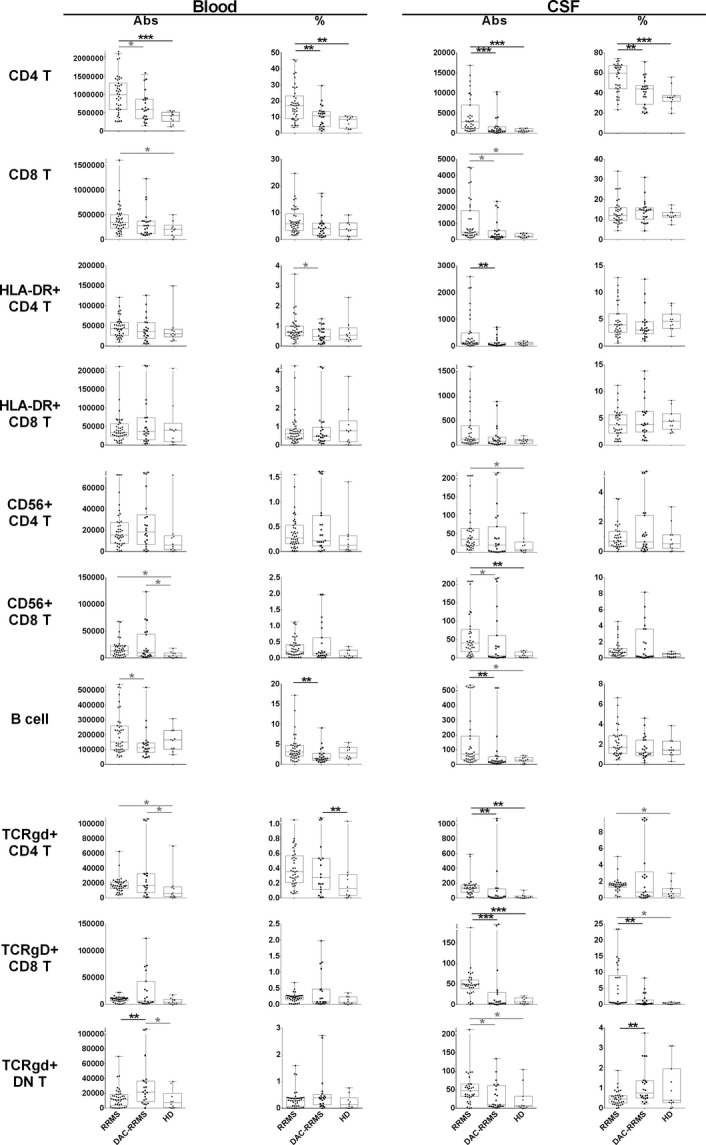
Figure 3.

Differences in proportions and absolute numbers of adaptive immune cells: CD4+ and CD8+ T cells and their subsets (HLA-DR+ effector cells and CD56+ cytotoxic cells), CD19+ B cells, TCRγ/δ T cells, TCRγ/δ CD4+ T cells, TCRγ/δ CD8+ T cells, and TCRγ/δ double negative T cells. The two left panels in each row represent proportions and absolute numbers of specific cell populations in the blood, while the two right panels represent proportions and absolute numbers of the same cell populations in the cerebrospinal fluid. Each diagnostic category corresponds to one vertical box-and-whisker plot. The boxes show the median and 25–75% range, while the whiskers indicate minimum and maximum values for each diagnostic category. The scatter dot plots represent data from individual patients. *P < 0.05, **0.001 < P < 0.05, ***P < 0.001.
