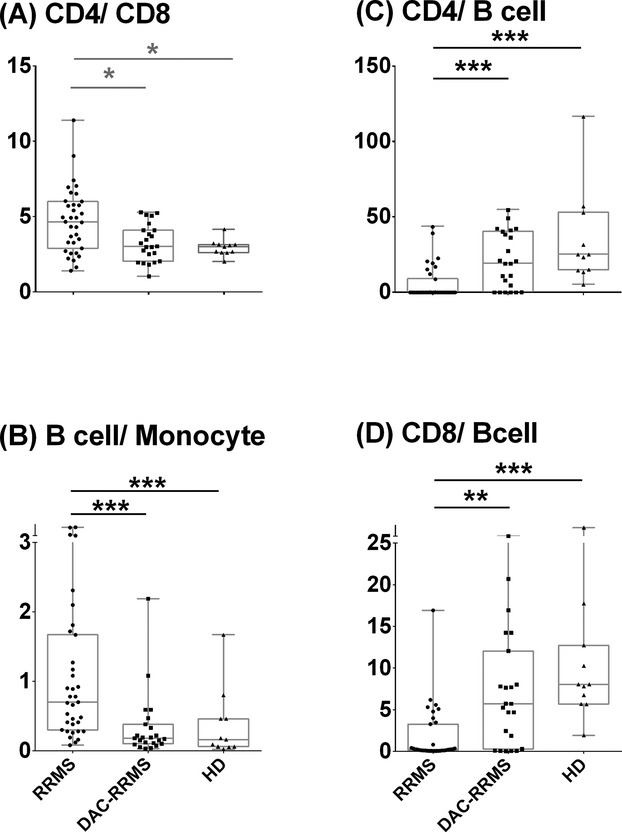
Figure 4.

Differences in intrathecal ratios of (A) CD4 to CD8, (B) B cell to monocyte, (C) CD4 to B cell, and (D) CD8 to B cell in CSF among diagnostic categories. The boxes show the median and 25–75% range, while the whiskers indicate minimum and maximum values for each diagnostic category. The scatter dot plots represent data from individual patients. *P < 0.05, **0.001 < P < 0.05, ***P < 0.001.
