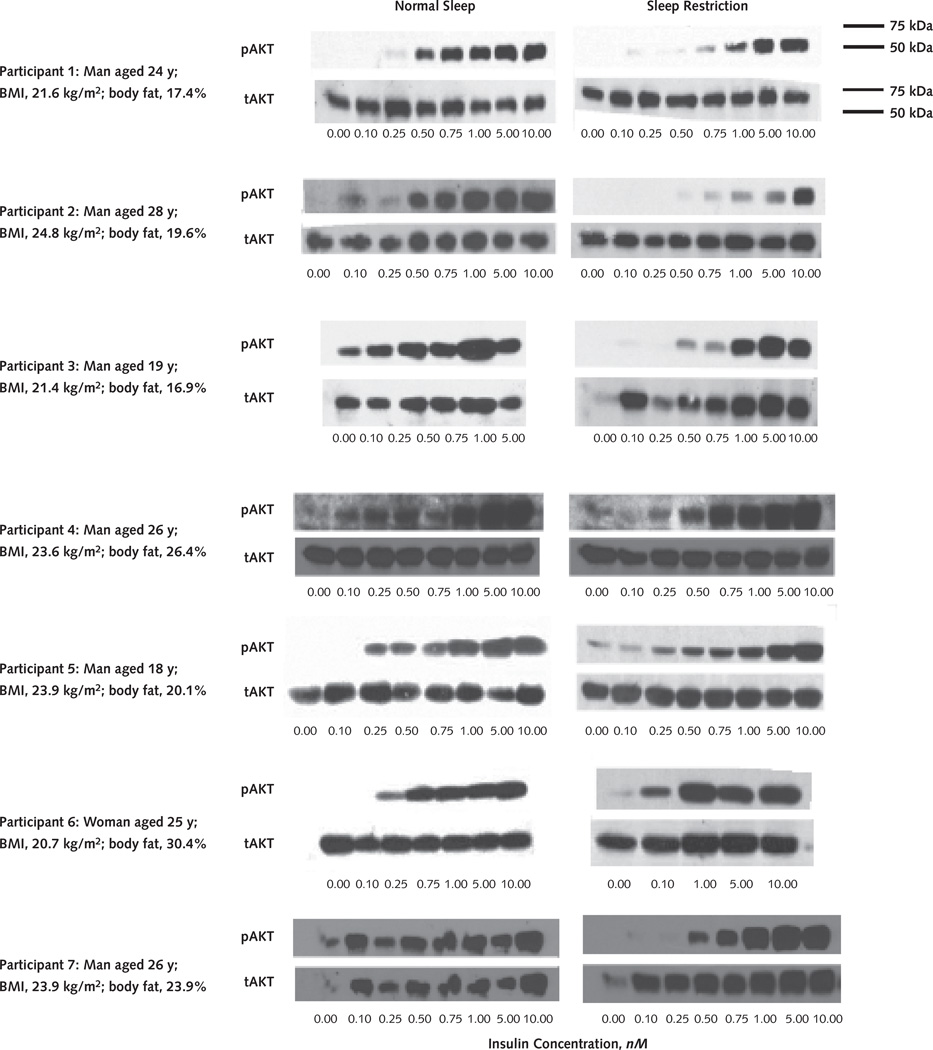
Figure 1. Insulin signaling in the adipocytes.
Individual Western blot tests show anti-pAkt and anti-tAkt responses to incremental increases in insulin concentrations in adipocytes under normal sleep and sleep restriction. Subcutaneous fat biopsies were performed on the same participants after normal sleep or sleep restriction conditions. Adipocytes were isolated by collagenase digestion, and isolated adipocytes were incubated in duplicate with increasing concentrations of insulin (0.00–10.00 nM). Samples were then frozen. All samples from the same participant from both sleep conditions were analyzed simultaneously by pAkt immunoblotting using identical exposure times. The same membranes were then stripped and reprobed with tAkt antibodies. The samples were not run on the same gel because of size constraints, but the 2 gels were transferred at the same time and the 2 membranes were processed in the same container. Molecular weight markers are shown on the upper right. Individual values for sex, age, BMI, and percentage of body fat (determined by an impedance technique) are provided for each participant. BMI = body mass index; pAkt = phosphorylated Akt; tAkt = total Akt.

