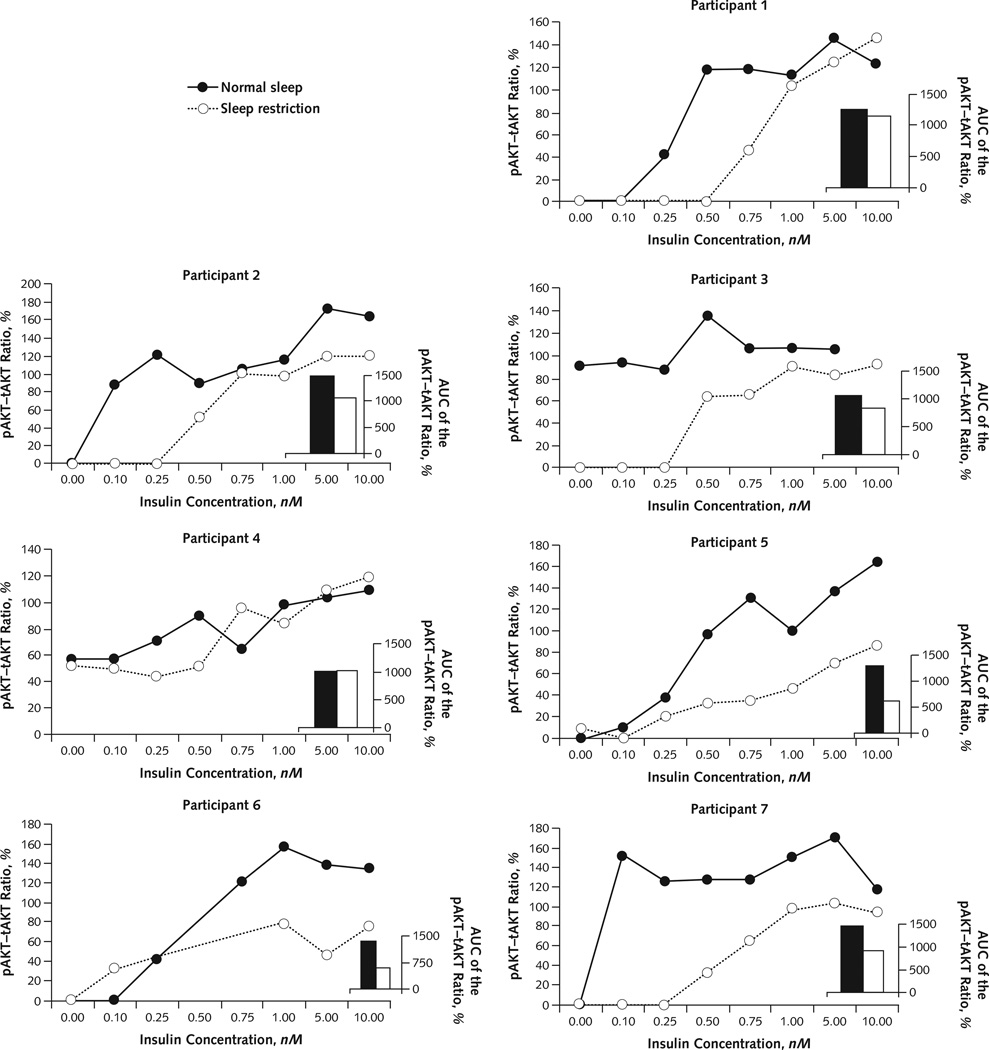
Figure 2. Densitometric quantification of pAkt–tAkt response.
Individual densitometric quantification of the dose-dependent responses of the pAkt–tAkt ratio to insulin stimulation in each participant under normal sleep and sleep restriction. Because of insufficient volume of biopsy samples, insulin concentrations of 0.25, 0.50, and 0.75 nM (under sleep restriction) and 0.50 nM (under normal sleep) in participant 6 and 10.00 nM (under normal sleep) in participant 3 were omitted. At an insulin concentration of 0.00 nM in participants 1, 2, 6, and 7 and 0.10 nM in participant 1, there was no measurable pAkt activation under either sleep condition; therefore, the data shown are superimposed. Note that pAkt and tAkt are measured using different antibodies; thus, the pAkt–tAkt ratio can vary outside of the range of 0% to 100%. AUC = area under the receiver-operating characteristic curve; pAkt = phosphorylated Akt; tAkt = total Akt.

