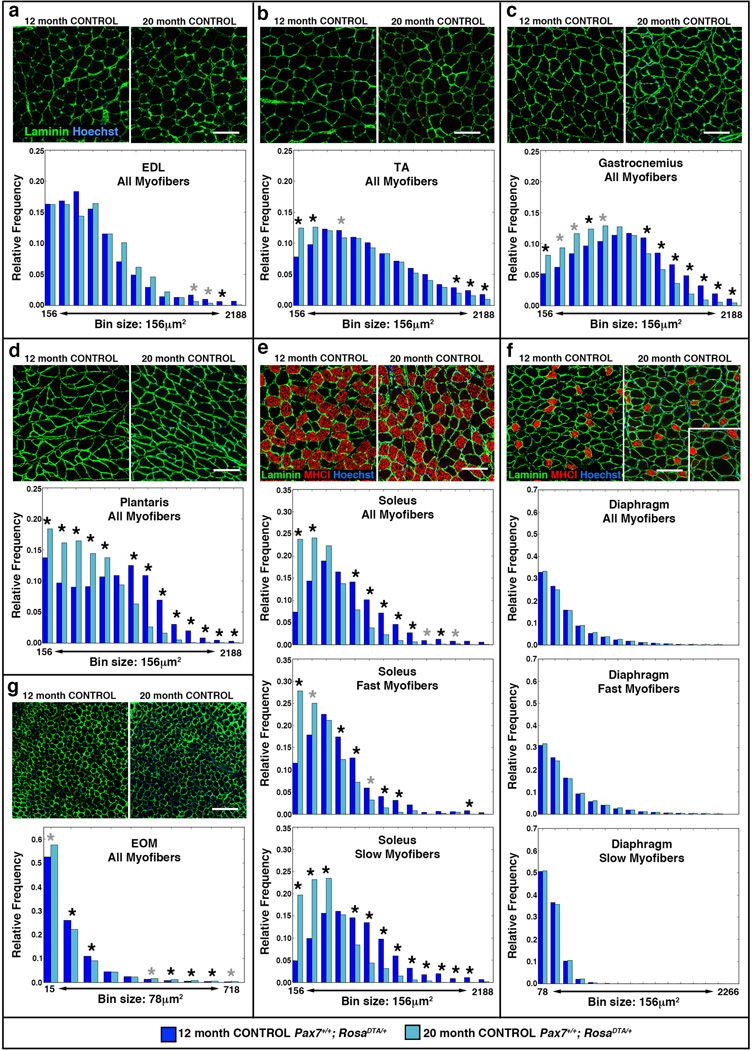
Figure 3. Myofibers decline in size in most limb muscles with age.
(a–g) Representative cross-sections showing outlined laminin+ myofibers in EDL, TA, gastrocnemius, plantaris, soleus, diaphragm, and EOM at 12 and 20 months in control Pax7+/+;RosaDTA/+ mice. Slow MyHCI+ fibers (red) are identified in (e) soleus and (f) diaphragm. Scale bar = 100 µm for all panels. Histograms generated by MuscleQNT show relative frequency of myofibers sizes in muscles at 12 months (dark blue, n = 7 for each muscle) and 20 months (light blue, n = 4 for EDL, n = 5 for other muscles). Additional histograms for (e) soleus and (f) diaphragm show relative frequency of fast MyHCI− and slow MyHCI+ myofibers in muscles at 12 and 20 months. Permutation tests were conducted to determine whether counts of myofibers were significantly different in a particular bin between 12 and 20 month muscles (see Methods). Black asterisks indicate an empirical p value of <0.05 and gray asterisks a value of <0.10 (see Methods).

