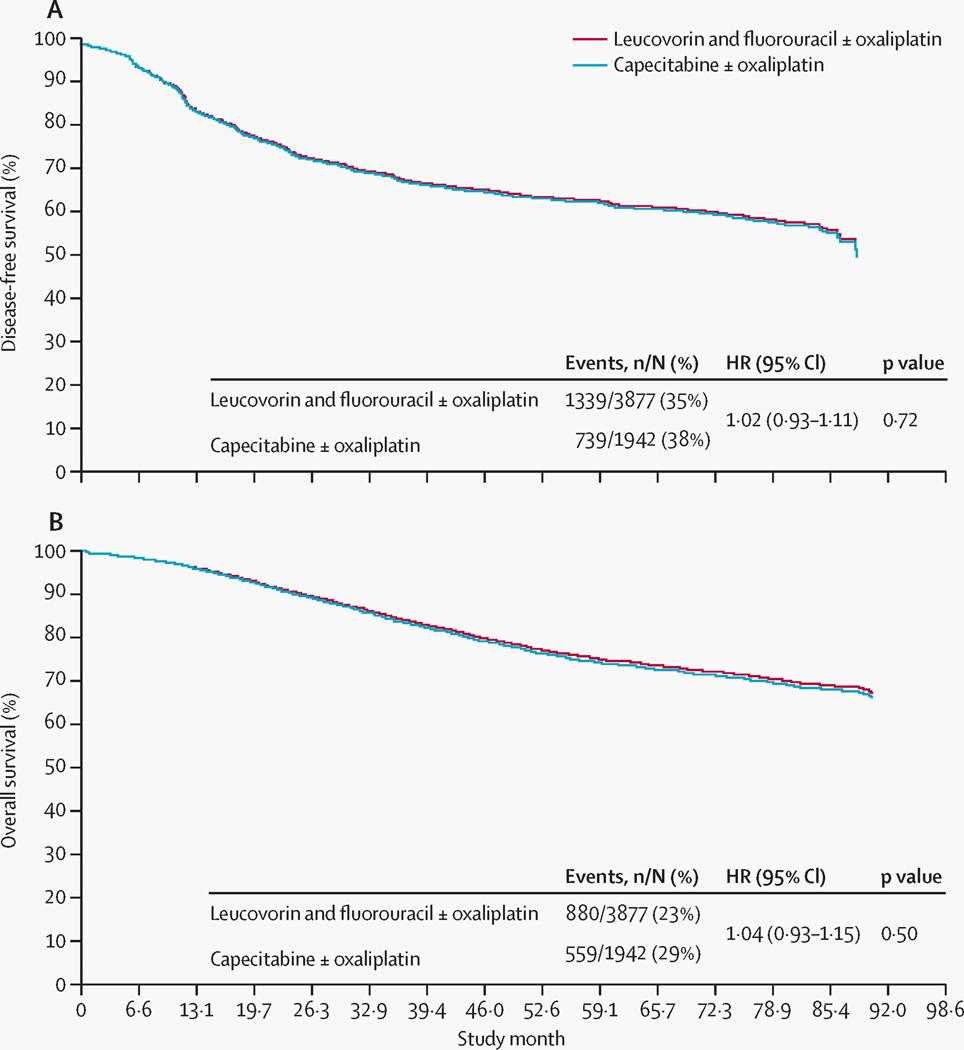
Figure 2. Adjusted survival curves.
(A) Disease-free survival and (B) overall survival for capecitabine with or without oxaliplatin versus leucovorin and fluorouracil with or without oxaliplatin, adjusted for sex, age, tumour (T) stage, and nodal (N) stage. ±=with or without. HR=hazard ratio. No numbers at risk are presented because this figure displays adjusted survival curves derived from a Cox proportional hazards regression model (rather than Kaplan–Meier survival analysis); hence, those data are not directly used.

