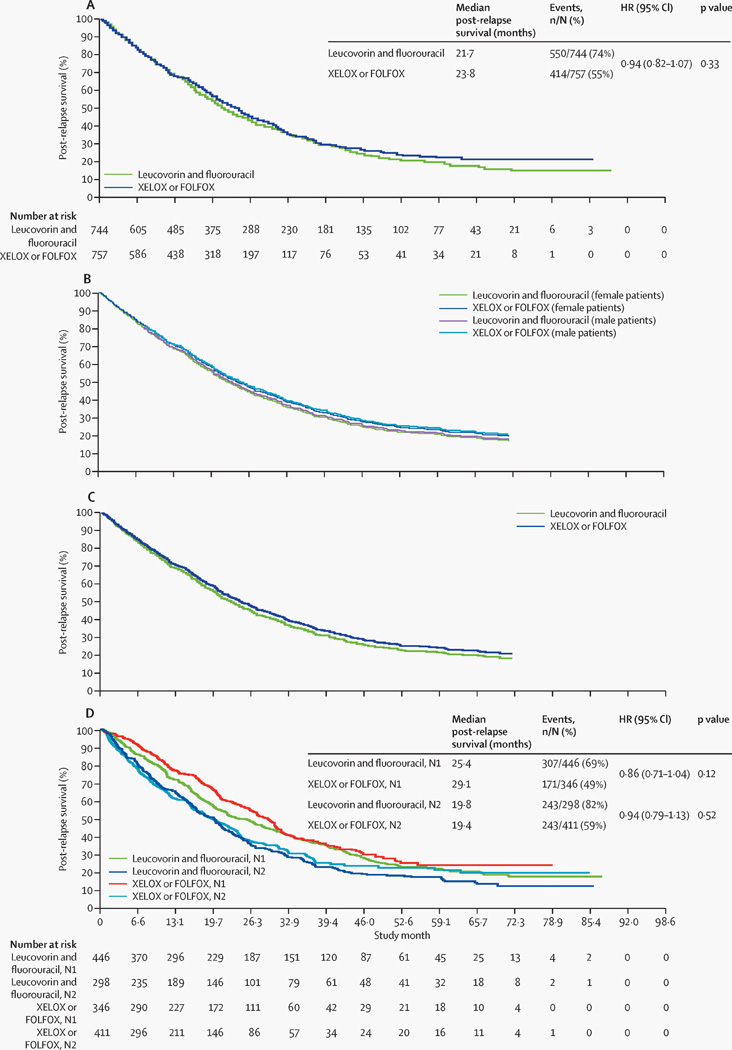
Figure 3. Post-relapse survival curves.
(A) Unadjusted Kaplan-Meier plot of post-relapse survival in patients receiving adjuvant capecitabine plus oxaliplatin (XELOX) or leucovorin and fluorouracil plus oxaliplatin (FOLFOX) compared with those receiving leucovorin and fluorouracil alone. (B) Adjusted post-relapse survival in patients receiving adjuvant capecitabine plus oxaliplatin (XELOX) or leucovorin and fluorouracil plus oxaliplatin (FOLFOX), compared with those receiving leucovorin and fluorouracil alone (adjusted for sex, age, tumour [T] stage, and nodal [N] stage), generated by the average covariate method. (C) Adjusted post-relapse survival in patients receiving adjuvant capecitabine plus oxaliplatin (XELOX) or leucovorin and fluorouracil plus oxaliplatin (FOLFOX), compared with those receiving leucovorin and fluorouracil alone (adjusted for sex, age, T stage, and N stage), generated by the corrected group prognosis method. (D) Unadjusted Kaplan-Meier plot of post-relapse survival in patients receiving adjuvant capecitabine plus oxaliplatin (XELOX) or leucovorin and fluorouracil plus oxaliplatin (FOLFOX) compared with those receiving leucovorin and fluorouracil alone, by nodal stage. HR=hazard ratio. XELOX=capecitabine plus oxaliplatin. FOLFOX=leucovorin and fluorouracil plus oxaliplatin. N=nodal stage. Please note that figures without numbers at risk display adjusted survival curves derived from a Cox proportional hazards regression model (rather than Kaplan–Meier survival analysis); hence, those data are not directly used.

